Category:Charts showing data through 2019
Jump to navigation
Jump to search
Deutsch: Statistiken bis zu und einschließlich 2019. Viele Grafiken fehlen hier noch – bitte hinzufügen.
English: Charts showing data up to and including 2019.
- Many charts are still missing – please help categorizing charts, e.g. from here. Outdated charts can often be updated. Only charts on notable subjects with specified data source(s) should be included.
Subcategories
This category has the following 2 subcategories, out of 2 total.
Media in category "Charts showing data through 2019"
The following 158 files are in this category, out of 158 total.
-
 3-Learning-curves-for-electricity-prices.png 2,879 × 2,478; 110 KB
-
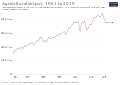
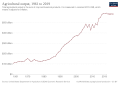
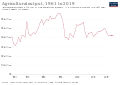
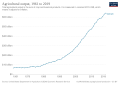
 Agricultural output Argentina.svg 850 × 600; 30 KB
-
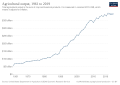
 Agricultural output Australia.svg 850 × 600; 30 KB
-
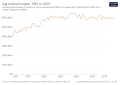
 Agricultural output Bangladesh.svg 850 × 600; 30 KB
-
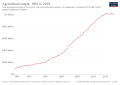
 Agricultural output Brazil.svg 850 × 600; 30 KB
-
 Agricultural output Egypt.svg 850 × 600; 30 KB
-
 Agricultural output Ethiopia.svg 850 × 600; 30 KB
-
 Agricultural output France.svg 850 × 600; 30 KB
-
 Agricultural output India.svg 850 × 600; 30 KB
-
 Agricultural output Japan.svg 850 × 600; 30 KB
-
 Agricultural output Kenya.svg 850 × 600; 30 KB
-
 Agricultural output of China.svg 850 × 600; 30 KB
-
 Agricultural output of Nigeria.svg 850 × 600; 30 KB
-
 Agricultural output of Pakistan.svg 850 × 600; 30 KB
-
 Agricultural output Pakistan.svg 850 × 600; 30 KB
-
 Agricultural output Russia.svg 850 × 600; 30 KB
-
 Agricultural output South Africa.svg 850 × 600; 30 KB
-
 Agricultural output Ukraine.svg 850 × 600; 30 KB
-
 Agricultural output United States.svg 850 × 600; 30 KB
-
 Agricultural output Vietnam.svg 850 × 600; 30 KB
-
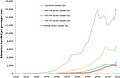
 Agricultural-output-dollars (OWID 0026).png 850 × 600; 51 KB
-

-
 Air-pollution-deaths-by-age (OWID 0074).png 850 × 600; 59 KB
-
 Annual air transport consumption in the UK by income quintile, 1920–2019.jpg 1,720 × 1,112; 305 KB
-
-
 Annual total CO₂ emissions, by world region.png 3,400 × 2,400; 531 KB
-
-
 Cancer-deaths-by-type.png 3,400 × 2,400; 742 KB
-
 Carbon Dioxide Partitioning.svg 960 × 696; 52 KB
-
 Cereal-yield-vs-extreme-poverty (OWID 0109).png 850 × 600; 74 KB
-
 Childhood-deaths-from-the-five-most-lethal-infectious-diseases-worldwide.png 3,400 × 2,400; 430 KB
-
 Contributors to London air pollution.png 1,030 × 628; 50 KB
-

-
 CO₂ emissions by sector, World.svg 850 × 600; 52 KB
-
 Cumulative-global-plastics (OWID 0211).png 850 × 600; 43 KB
-
 Death-rates-natural-disasters (OWID 0308).png 850 × 600; 62 KB
-
 Deaths in age brackets due to alcohol in the UK.svg 850 × 600; 30 KB
-
 Deaths-from-air-pollution (OWID 0303).png 850 × 600; 48 KB
-
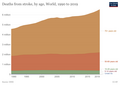
 Deaths-from-indoor-air-pollution-by-age (OWID 0298).png 850 × 600; 52 KB
-
 Defaulting summary of the listed highly hazardous chemicals analysed in this study.webp 1,821 × 2,008; 289 KB
-
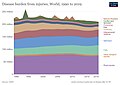
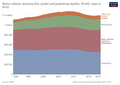
 Disease burden from non-communicable diseases, OWID.svg 850 × 600; 36 KB
-
 Disease-burden-from-injuries.jpg 3,400 × 2,400; 475 KB
-
 Earth's Heat Accumulation.png 954 × 672; 144 KB
-
 Earth's heating rate since 2005.jpg 2,128 × 1,680; 398 KB
-
 Economic damage by natural disaster type, OWID.svg 850 × 600; 133 KB
-
 Example of a google Ngram.jpg 1,947 × 1,071; 352 KB
-
 Fertilizer-consumption-usda (OWID 0449).png 850 × 600; 48 KB
-
 Fertilizer-production-by-nutrient-type-npk (OWID 0446).png 850 × 600; 58 KB
-
 Fertilizer-use-nutrient (OWID 0443).png 850 × 600; 61 KB
-
 Forest carbon loss across the tropics during 2001–2019.webp 1,617 × 574; 56 KB
-

-
 Global damage costs from natural disasters, OWID.svg 850 × 600; 10 KB
-

-
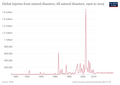
 Global deaths from natural disasters, OWID.svg 850 × 600; 11 KB
-
 Global injuries from natural disasters, OWID.svg 850 × 600; 11 KB
-
 Global natural disaster death rates, OWID.svg 850 × 600; 11 KB
-
 Global number affected by natural disasters, OWID.svg 850 × 600; 18 KB
-
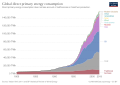 Global primary energy consumption, OWID.svg 850 × 600; 54 KB
-
 Global trend of marine plastic pollution from 1979 to 2019.png 1,250 × 827; 139 KB
-

-
 Greece - Share of CO2 emissions are produced from different fuels.png 1,444 × 1,070; 170 KB
-
 Greenhouse gas emissions in Turkey by sector.png 3,400 × 3,391; 1.37 MB
-
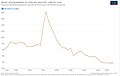
 GSTA 1850-2019.png 640 × 480; 46 KB
-
 Incidence-and-prevalence-of-rabies.png 3,400 × 2,400; 314 KB
-
 Infectious-disease-death-rates.jpg 3,400 × 2,400; 93 KB
-
 Latif 2022 AMOC 120y series.png 886 × 570; 87 KB
-
 LCOE of Concentrating Solar Power from 2006-2019.jpg 1,200 × 502; 70 KB
-
 Level-of-income-top-10-vs-bottom-10 (OWID 0571).png 850 × 600; 56 KB
-
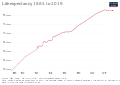 Life expectancy development in Australia.svg 850 × 600; 35 KB
-
 Life expectancy in select African countries, 1950–2019.jpg 1,030 × 644; 56 KB
-
 Macroplastics-in-ocean (OWID 0563).png 850 × 600; 73 KB
-
 Malariadeathsbyregion.png 3,400 × 2,400; 452 KB
-
 Mass changes of the Greenland Ice Sheet between 2002 and 2019.webp 1,296 × 1,094; 109 KB
-
 Material-footprint-per-capita (OWID 0550).png 850 × 600; 37 KB
-
 Mobile cellular subscriptions per 100 people (as of 2019).svg 850 × 600; 45 KB
-
 Multidrug-resistant-tuberculosis-without-extensive-drug-resistance.png 3,400 × 2,400; 331 KB
-
 Multilateral environmental treaties-by-decennium-subject-en.svg 484 × 375; 87 KB
-
 Multilateral environmental treaties-by-year-and-type-en.svg 484 × 375; 84 KB
-
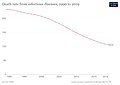
 Natural-disaster-deaths-ihme (OWID 0642).png 850 × 600; 43 KB
-
 Natural-resource-rents (OWID 0636).png 850 × 600; 60 KB
-
 New Zealand electricity consumption 1974–2019.png 2,112 × 1,198; 144 KB
-
 New-passenger-vehicles-type (OWID 0631).png 850 × 600; 56 KB
-
 Ngram 2024-03-14 at 12.26.34 PM.png 1,758 × 1,214; 206 KB
-
 Non-agricultural-share-of-labour-force (OWID 0619).png 850 × 600; 70 KB
-
 Number left homeless from natural disasters, OWID.svg 850 × 600; 10 KB
-

-
 Number of countries where homosexuality is legal, OWID.svg 850 × 600; 15 KB
-
 Number of deaths by world region.svg 850 × 600; 41 KB
-

-
 Number of people affected by natural disasters, OWID.svg 850 × 600; 16 KB
-
 Number of recorded earthquake disaster events from 1901, OWID.png 3,400 × 2,400; 608 KB
-
 Number of recorded natural disaster events, OWID.svg 850 × 600; 10 KB
-
 Number of tourists in Morocco.svg 850 × 600; 27 KB
-
 Number-injured-from-disasters.png 3,400 × 2,400; 426 KB
-
 Number-of-deaths-from-diarrheal-diseases-by-risk-factor-for-under-5s.png 3,400 × 2,400; 508 KB
-
 Number-of-deaths-from-tuberculosis-by-world-region.png 3,400 × 2,400; 475 KB
-
 Number-of-people-employed-in-agriculture (OWID 0729).png 850 × 600; 89 KB
-
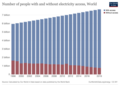 Number-of-people-with-and-without-electricity-access.png 3,400 × 2,400; 477 KB
-
-
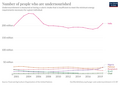 Number-undernourished (OWID 0717).png 850 × 600; 63 KB
-
 Number-without-electricity-by-region (OWID 0715).png 850 × 600; 80 KB
-
 Outdoor air pollution death rate, 1990 to 2019.svg 850 × 600; 35 KB
-
 Palm-oil-production (OWID 0682).png 850 × 600; 40 KB
-
-
 Per-capita-methane-agriculture (OWID 0749).png 850 × 600; 80 KB
-
 Per-capita-nitrous-oxide-agriculture (OWID 0747).png 850 × 600; 81 KB
-
 Poland electricity production.svg 639 × 559; 108 KB
-
 Poverty in Bangladesh.jpg 1,014 × 650; 43 KB
-
 Poverty in China.jpg 1,022 × 648; 43 KB
-
 Poverty in DR Congo.jpg 1,022 × 646; 41 KB
-
 Poverty in Ethiopia.jpg 1,034 × 648; 47 KB
-
 Poverty in Ghana.jpg 1,028 × 649; 44 KB
-
 Poverty in Indonesia.jpg 1,020 × 647; 46 KB
-
 Poverty in Mexico.jpg 1,024 × 651; 49 KB
-
 Poverty in Pakistan.jpg 1,011 × 646; 44 KB
-
 Poverty in the Philippines.jpg 1,031 × 648; 44 KB
-
 Poverty in Vietnam.jpg 1,034 × 646; 46 KB
-
 Poverty in Zimbabwe.jpg 1,042 × 650; 49 KB
-
 Prevalence-of-alcohol-use-disorders-by-age.png 3,400 × 2,400; 478 KB
-
 Prevalenceanemiachildren.png 3,400 × 2,400; 409 KB
-
 Price-of-electricity-new-fossil-and-nuclear.png 2,426 × 3,035; 249 KB
-
 Price-of-electricity-new-renewables-vs-new-fossil-no-geo.png 2,426 × 3,747; 362 KB
-
 Respiratory-disease-deaths-by-age.png 3,400 × 2,400; 327 KB
-
 Road-deaths-by-type.png 3,400 × 2,400; 377 KB
-
 Road-incident-deaths-by-age.png 3,400 × 2,400; 366 KB
-
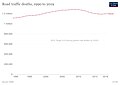 Road-traffic-deaths-sdgs.jpg 3,400 × 2,400; 109 KB
-
 Seafood-and-fish-production-thousand-tonnes (OWID 0950).png 850 × 600; 74 KB
-
 Share of countries where homosexuality is legal, OWID.svg 850 × 600; 8 KB
-
 SO2 emissions in the world and selected countries.png 3,400 × 2,400; 542 KB
-
 Solar PV module prices.jpg 839 × 581; 32 KB
-
 Solar-pv-prices-vs-cumulative-capacity.png 1,998 × 2,058; 290 KB
-
 Stroke-death-rates-by-age.png 3,400 × 2,400; 345 KB
-
 Stroke-deaths-by-age (1).png 3,400 × 2,400; 318 KB
-
 Studies about pandemic prevention in PubMed by year until 2019.png 2,048 × 1,792; 162 KB
-
 Sustainable-fisheries-as-a-proportion-of-gdp.png 3,400 × 2,400; 357 KB
-
 Technology adoption by households in the U.S.svg 850 × 600; 83 KB
-
 Technology adoption in US households, OWID.svg 850 × 600; 18 KB
-
 The-number-of-new-tetanus-infections-by-world-region.png 3,400 × 2,400; 513 KB
-
 Three measures of cancer mortality, OWID.svg 850 × 600; 34 KB
-
 Tourism in Azerbaijan.svg 850 × 600; 27 KB
-
 Tourism in Bolivia.svg 850 × 600; 27 KB
-
 Tourism in Brazil.svg 850 × 600; 27 KB
-
 Tourism in Indonesia.svg 850 × 600; 27 KB
-
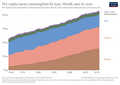
 Tourism in Iran.svg 850 × 600; 26 KB
-
 Tourism in Kazakhstan.svg 850 × 600; 26 KB
-
 Tourism in Kenya.svg 850 × 600; 26 KB
-
 Tourism in Romania.svg 850 × 600; 27 KB
-
 Tourism in Saudi Arabia.svg 850 × 600; 26 KB
-
 Tourism in Syria.svg 850 × 600; 26 KB
-
 Tourism in Thailand.svg 850 × 600; 27 KB
-
 Tourism in Tunisia.svg 850 × 600; 26 KB
-
 Tourism in Turkey.svg 850 × 600; 27 KB
-
 Treatment-of-hazardous-waste (OWID 1130).png 850 × 600; 64 KB
-
 Tuberculosis-deaths-by-age.jpg 3,400 × 2,400; 149 KB
-
 Two-centuries-World-as-100-people.png 3,690 × 2,442; 307 KB
-
 Wikipedia page views by language over time.png 3,425 × 2,257; 518 KB
-
 World population by region (HYDE (1820 to 2019)), OWID.svg 850 × 600; 23 KB
-
 World population since 10,000 BCE (OurWorldInData series), OWID.svg 850 × 600; 32 KB


.png)
.png)
.png)


.png)


.png)
.png)

.png)
.png)


.png)
.png)
.png)
.webp)

),_OWID.svg)


_from_domesticated_species_and_their_wild_relatives.webp)


.png)


.png)


.png)
.svg)


.png)
.png)

.png)

.png)


_and_new_gene-disease_links_per_year_(blue_bars).webp)


.png)

,-the-solar-F10.png)
.png)
.png)

.png)
.png)
.png)
.png)


.png)


.png)


.png)


),_OWID.svg)
,_OWID.svg)