Category:Charts showing data through 2016
Jump to navigation
Jump to search
Deutsch: Statistiken bis zu und einschließlich 2016. Viele Grafiken fehlen hier noch – bitte hinzufügen.
English: Charts showing data up to and including 2016.
- Many charts are still missing – please help categorizing charts, e.g. from here. Outdated charts can often be updated. Only charts on notable subjects with specified data source(s) should be included.
Subcategories
This category has only the following subcategory.
Media in category "Charts showing data through 2016"
The following 77 files are in this category, out of 77 total.
-
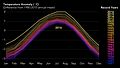
 20160411 Global warming line chart (1850-2016) - Ed Hawkins.png 1,747 × 1,122; 301 KB
-
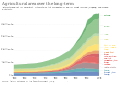 Agricultural area over the long-term, OWID.svg 850 × 600; 31 KB
-
 Agricultural-export-subsidies.png 3,400 × 2,400; 456 KB
-
 Air pollutant emissions, OWID.svg 850 × 600; 13 KB
-
 Air-pollution-london (OWID 0075).png 850 × 600; 55 KB
-
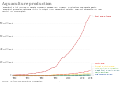 Aquaculture production, OWID.svg 850 × 600; 27 KB
-
 AustralianReligiousAffiliation 2.svg 600 × 400; 166 KB
-
 Battery-cost-learning-curve.png 1,773 × 2,106; 188 KB
-
 Battle-related deaths in state-based conflicts since 1946, OWID.svg 850 × 600; 17 KB
-
-
 Biomass-fish-stocks-taxa (OWID 0140).png 850 × 600; 62 KB
-
 Cancer deaths by type, 2, OWID.svg 850 × 600; 32 KB
-
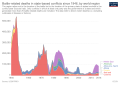
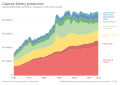 Capture fishery production, OWID.svg 850 × 600; 22 KB
-
 Carbon budget eng.png 989 × 758; 279 KB
-
-
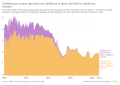
 Children-who-are-overweight.png 3,400 × 2,400; 461 KB
-
 Chinese-plastic-imports (OWID 0150).png 850 × 600; 54 KB
-
 Cholera-deaths-in-great-britain.png 3,400 × 2,400; 315 KB
-
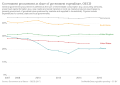
 Consumption of ozone-depleting substances (1986 = 100), OWID.svg 850 × 600; 6 KB
-
 Coral-bleaching-events (OWID 0244).png 850 × 600; 60 KB
-
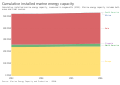 Cumulative installed marine energy capacity, OWID.svg 850 × 600; 9 KB
-
-
 DALYs from autistic spectrum disorders, OWID.svg 850 × 600; 6 KB
-
 Deaths from dementia-related diseases, by age, OWID.svg 850 × 600; 11 KB
-
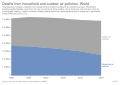 Deaths from household and outdoor air pollution, OWID.svg 850 × 600; 6 KB
-
 Deaths from indoor air pollution, by age, OWID.svg 850 × 600; 18 KB
-
 Deforestation-drivers-indonesia (OWID 0294).png 850 × 600; 56 KB
-

-
 Emissions of air pollutants, OWID.svg 850 × 600; 14 KB
-
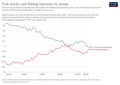 Fish-stocks-taxa (OWID 0426).png 850 × 600; 78 KB
-
 Ghgs-epcia-holocene-CO2-en.svg 1,000 × 400; 72 KB
-
 Global-living-planet-index,1970-2016.svg 850 × 600; 19 KB
-
 Global-warming-2016.jpg 1,920 × 1,080; 847 KB
-
 Globalization over 5 centuries, OWID.svg 850 × 600; 20 KB
-
-
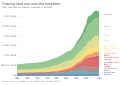 Grazing land use over the long-term, OWID.svg 850 × 600; 31 KB
-
 Greenhouse gas emissions by sector, Greece 2016.png 1,504 × 938; 174 KB
-
 Greenhouse-gas-emissions-by-sector.png 3,400 × 2,400; 636 KB
-
 Investment in renewable energy, by technology, OWID.svg 850 × 600; 18 KB
-
 Kaya-identity-co2.svg 850 × 600; 46 KB
-
 Land-use-over-the-long-term (OWID 0584).png 850 × 600; 47 KB
-
 Literacy-rate.svg 850 × 600; 26 KB
-
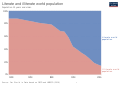
 Literate and illiterate world population.png 1,038 × 679; 31 KB
-

-
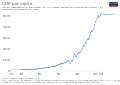 Maddison-data-gdp-per-capita-in-2011us-single-benchmark (1).svg 850 × 600; 29 KB
-
 Moore's Law Transistor Count 1971-2016.png 3,000 × 2,191; 473 KB
-
 NAND Fscaling 02.png 4,554 × 2,798; 1.95 MB
-
 Nitrous oxide (N₂O) atmospheric concentration, OWID.svg 850 × 600; 9 KB
-
 Nitrous oxide emissions from agriculture, OWID.svg 850 × 600; 19 KB
-
 Number of Births and Birthrate, Japan.svg 640 × 480; 8 KB
-

-
 Number of homeless people, by shelter status, OWID.svg 850 × 600; 6 KB
-
 Number of people defined as undernourished, OWID.svg 850 × 600; 7 KB
-
 Number of people who are undernourished, 1, OWID.svg 850 × 600; 7 KB
-
 Number of people with and without electricity access, OWID.svg 850 × 600; 12 KB
-
 Number of reported road incidents, OWID.svg 850 × 600; 9 KB
-
 Number of severely food insecure people by region, OWID.svg 850 × 600; 7 KB
-

-
 Outdoor air pollution deaths by age, OWID.svg 850 × 600; 21 KB
-
 People without access to electricity by region, OWID.svg 850 × 600; 15 KB
-

-
 Prevalence of severe food insecurity by region, OWID.svg 850 × 600; 9 KB
-
 Prevalence-of-daily-smoking-sdgs.png 3,400 × 2,400; 367 KB
-
 Rail transport in Europe.png 709 × 487; 21 KB
-

-
-

-
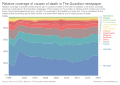
 Relative share of Google searches for causes of death, OWID.svg 850 × 600; 18 KB
-
 Severe-bleaching-events-enso (OWID 0949).png 850 × 600; 57 KB
-
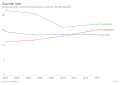 Suicide rate (World Bank (2000 to 2016)), OWID.svg 850 × 600; 5 KB
-
-
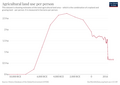 Total-agricultural-land-use-per-person (OWID 1037).png 850 × 600; 49 KB
-
 Transport modal share from 1952-2014.png 1,075 × 625; 34 KB
-

-
 Urbanization since 1500.png 1,648 × 1,100; 199 KB
-

-
 World Photovoltaics Installed Capacity.svg 800 × 600; 15 KB
_-_Ed_Hawkins.png)


.png)


.png)


.png)

,_OWID.svg)
.png)

_rate_from_alcohol_and_drug_use_disorders,_OWID.svg)


.png)


.png)


.png)


.svg)

_atmospheric_concentration,_OWID.svg)


_by_shelter_status,_OWID.svg)


.png)


),_OWID.svg)


,_OWID.svg)

.png)
),_OWID.svg)
.png)
.png)
),_OWID.svg)


