Category:Charts showing data through 2018
Jump to navigation
Jump to search
Deutsch: Statistiken bis zu und einschließlich 2018. Viele Grafiken fehlen hier noch – bitte hinzufügen.
English: Charts showing data up to and including 2018.
- Many charts are still missing – please help categorizing charts, e.g. from here. Outdated charts can often be updated. Only charts on notable subjects with specified data source(s) should be included.
Subcategories
This category has the following 2 subcategories, out of 2 total.
Media in category "Charts showing data through 2018"
The following 108 files are in this category, out of 108 total.
-

-

-
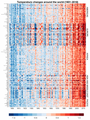 20190721 STACKED warming stripes - all countries - Climate Lab Book (Ed Hawkins).png 7,547 × 10,071; 1.07 MB
-
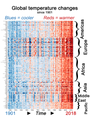 20190907 STACKED global warming stripes (large legends) - derived from Ed Hawkins.png 3,000 × 4,000; 1.12 MB
-
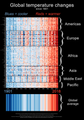 20190909 STACKED country warming stripes AND global average (1901- ).png 3,500 × 5,000; 1,011 KB
-
 20190912 Stacked warming stripes - atmospheric layers (derived from Ed Hawkins).png 4,116 × 2,392; 122 KB
-
 20191206 Warming stripes at COP25 - John Englart flickr.jpg 4,032 × 3,024; 963 KB
-
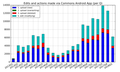
 737 vs a320 family deliveries per model 1967-2018.png 1,004 × 626; 154 KB
-
 737-deliveries-per-year-1967-2018.png 993 × 615; 362 KB
-
 Ace-north-atlantic-hurricanes (OWID 0040).png 850 × 600; 73 KB
-
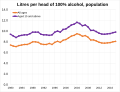 Alcohol consumption rate in the United Kingdom.svg 2,504 × 1,916; 24 KB
-
 Amazon over time.png 1,192 × 784; 45 KB
-
 Annual-CO2-emissions-by-region.png 3,293 × 1,818; 500 KB
-
 Annual-fish-catch-taxa (OWID 0043).png 850 × 600; 106 KB
-
 Asbestos-world-production-1900-2100.jpg 2,267 × 1,304; 244 KB
-
 Atmospheric CO₂ concentration, OWID.svg 850 × 600; 20 KB
-
 Biomass-fish-stocks-region (OWID 0078).png 850 × 600; 81 KB
-
 Change-in-cfc-11-concentrations (OWID 0157).png 850 × 600; 69 KB
-
 CO2 emissions fraction of Aviation (%).png 600 × 429; 18 KB
-
 Co2-emissions-by-fuel-line1800-2018.svg 850 × 600; 30 KB
-
 Daily hours spent with digital media, OWID.svg 850 × 600; 9 KB
-
 Daily per-capita food energy supply of countries.svg 850 × 600; 62 KB
-
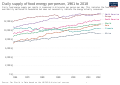 Daily per-capita food energy supply of regions.svg 850 × 600; 68 KB
-
 Daily-per-capita-caloric-supply-countries.svg 850 × 600; 62 KB
-
 Deforestation continues to expand within the Amazon forest system.webp 1,584 × 2,521; 457 KB
-
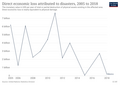 Direct economic loss attributed to disasters in Mexico from 2005, OWID.png 3,400 × 2,400; 477 KB
-

-
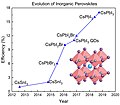 Efficiency history of inorganic perovskites, basic structure.jpg 5,081 × 4,434; 1.06 MB
-
 En Wikipedia Articles.png 704 × 477; 17 KB
-
 European Union Population Projections by Fertility Scenario.jpg 3,881 × 2,288; 473 KB
-
 European Union Population Projections.jpg 3,328 × 1,797; 418 KB
-
 Eurostat EU-27 immigration and emigration 2013-2018.png 613 × 596; 64 KB
-
 Fish-catch-gear-type (OWID 0440).png 850 × 600; 89 KB
-
 Fish-landings-and-discards (OWID 0434).png 850 × 600; 63 KB
-
 Fishing-pressure-by-region (OWID 0427).png 850 × 600; 88 KB
-
 Fishing-pressure-by-taxa (OWID 0428).png 850 × 600; 85 KB
-
 FPV installed capacity.jpg 779 × 514; 33 KB
-
-
 GDP per capita Baltics.svg 850 × 600; 37 KB
-
 GDP per capita develoment of Haiti.svg 850 × 600; 31 KB
-
 GDP per capita development development of Ghana.svg 850 × 600; 31 KB
-
 GDP per capita development in Central Asia.svg 850 × 600; 46 KB
-
 GDP per capita development in East Asia.svg 850 × 600; 51 KB
-
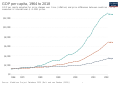
 GDP per capita development in Europe, 1820 to 2018.svg 850 × 600; 29 KB
-
 GDP per capita development in Iran 1950-2018.svg 850 × 590; 23 KB
-
 GDP per capita development of Bosnia and Herzegovina.svg 850 × 600; 31 KB
-
 GDP per capita development of Burundi.svg 850 × 600; 31 KB
-
 GDP per capita development of Cuba.svg 850 × 600; 37 KB
-
 GDP per capita development of Greece.svg 850 × 600; 43 KB
-
 GDP per capita development of Moldova.svg 850 × 600; 28 KB
-
 GDP per capita development of Niger.svg 850 × 600; 31 KB
-
 GDP per capita development of Nigeria.svg 850 × 600; 31 KB
-
 GDP per capita development of Uganda.svg 850 × 600; 31 KB
-
 Global CO₂ atmospheric concentration, OWID.svg 850 × 600; 15 KB
-
 Global reported natural disasters by type, OWID.svg 850 × 600; 60 KB
-
 Global-living-planet-index (OWID 0539).png 850 × 600; 65 KB
-
 GPD per capita development of Kenya.svg 850 × 600; 41 KB
-
 Graph of papers published in Economic Research by year.png 1,655 × 992; 49 KB
-
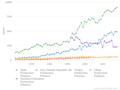
 Historical economic growth of Japan.jpg 1,013 × 649; 43 KB
-
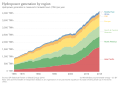 Hydropower generation by region, OWID.svg 850 × 600; 21 KB
-
 Improved-weather-forecasting 7463.png 7,463 × 6,130; 787 KB
-
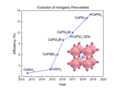 Inorganic Perovskites Efficiency Evolution and Structure.png 3,216 × 2,461; 273 KB
-
 Israel war crimes ngram views.png 1,174 × 429; 54 KB
-
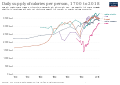
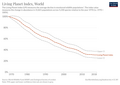
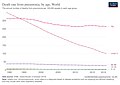
 Life expectancy by world region, from 1770 to 2018.svg 850 × 600; 42 KB
-
 Life expectancy vs healthcare spending.jpg 1,876 × 1,816; 553 KB
-
 Mammal cloning publications over time and breed differences.webp 1,498 × 1,472; 130 KB
-
 Mauna Loa Carbon Dioxide.svg 600 × 350; 50 KB
-

-
 MedEditorTrends.png 589 × 726; 79 KB
-
 Methane (CH₄) atmospheric concentration, OWID.svg 850 × 600; 9 KB
-
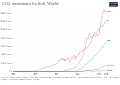
 Moore's Law Transistor Count 1971-2018.png 6,529 × 4,716; 955 KB
-

-
 Number-of-severely-food-insecure-people-by-region.png 3,400 × 2,400; 502 KB
-
 Numbers of autocracies and democracies.png 3,184 × 1,916; 272 KB
-
 OceanHeatContent Cheng-en.svg 1,000 × 600; 71 KB
-
 Ozone-depleting-substances-index (OWID 0684).png 850 × 600; 48 KB
-
 Per capita annual meat consumption by region.png 1,299 × 776; 107 KB
-

-

-
 Per-capita-meat-eu28 (OWID 0754).png 850 × 600; 62 KB
-
 Per-capita-meat-usa (OWID 0751).png 850 × 600; 62 KB
-
 Petroleum production consumption.png 784 × 476; 48 KB
-
 Pista Yield chart.png 1,200 × 900; 164 KB
-
 PlotEditorsCOMMONS statswikimedia.png 640 × 240; 37 KB
-
 Pneumonia-mortality-by-age.jpg 2,656 × 1,875; 370 KB
-
 Population projections of France by the UN up to 2100.svg 850 × 600; 35 KB
-
 Potato chart.png 1,200 × 900; 116 KB
-
 PotatoYeild chart.png 1,200 × 900; 154 KB
-
 Real GDP per capita development of Uzbekistan.svg 850 × 600; 28 KB
-
 Remittance costs as a proportion of the amount remitted, OWID.svg 850 × 600; 11 KB
-
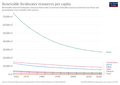 Renewable-water-resources-per-capita (OWID 0862).png 850 × 600; 69 KB
-
 Soja-Anbauflächen der fünf wichtigsten Produktionsländer.svg 301 × 285; 441 KB
-
 Statistics of uploads vs deletes from Commons app 01.png 855 × 510; 58 KB
-
-
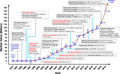
 Timeline of the annual number of journal publications about climate litigation.jpg 3,517 × 1,556; 375 KB
-
 Top 3 countries' projected population.svg 850 × 600; 33 KB
-

-
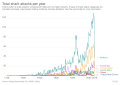
 Total annual meat consumption by region.png 1,263 × 821; 81 KB
-
 Total annual meat consumption by type of meat.png 1,108 × 861; 82 KB
-
 Total number of fatal shark attacks, OWID.svg 850 × 600; 12 KB
-
 Total shark attacks per year, OWID.svg 850 × 600; 14 KB
-
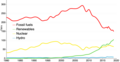 UK electricity production by source.png 1,098 × 567; 82 KB
-
 Visites Mensuelles sur DeepL.png 1,326 × 662; 37 KB
-
 Walnut chart.png 1,200 × 900; 99 KB
-
 Whale-catch (OWID 1109).png 850 × 600; 108 KB
-

-
 Wild-fish-catch-gear-type.svg 850 × 600; 49 KB
-
 Zunahme Weltverbauch nach Fleischarten bis 2018.svg 314 × 241; 97 KB
.png)
_-_derived_from_Ed_Hawkins.png)
.png)
.png)


.png)


.png)


.png)
.png)
.png)


.png)
.png)
.png)
.png)


.png)


_atmospheric_concentration,_OWID.svg)


.png)

,_OWID.svg)
,_OWID.svg)
.png)
.png)


.png)


_per_publisher_per_year.png)


.png)


_-_Climate_Lab_Book_(Ed_Hawkins).png)
_-_Climate_Lab_Book_(Ed_Hawkins).svg)