Category:Charts showing data through 2020
Jump to navigation
Jump to search
Deutsch: Statistiken bis zu und einschließlich 2020. Viele Grafiken fehlen hier noch – bitte hinzufügen.
English: Charts showing data up to and including 2020.
- Many charts are still missing – please help categorizing charts, e.g. from here. Outdated charts can often be updated. Only charts on notable subjects with specified data source(s) should be included.
| NO WIKIDATA ID FOUND! Search for Charts showing data through 2020 on Wikidata | |
| Upload media |
Subcategories
This category has the following 3 subcategories, out of 3 total.
Media in category "Charts showing data through 2020"
The following 127 files are in this category, out of 127 total.
-
 Academic papers by discipline (visualization of 2012–2021 OpenAlex data; v2).png 1,293 × 840; 185 KB
-
 Acres-burned-per-wildfire-usa (OWID 0038).png 850 × 600; 52 KB
-
 Acres-burned-usa (OWID 0039).png 850 × 600; 52 KB
-
 Animals-slaughtered-for-meat (OWID 0068).png 850 × 600; 58 KB
-
 Annual air transport consumption in the UK by income quintile, 1920–2019.jpg 1,720 × 1,112; 305 KB
-
 Annual CO2 emissions by fuel.png 3,400 × 2,400; 380 KB
-
 Annual traffic deaths by age Netherlands 1950-2020.png 1,281 × 833; 82 KB
-
 Annual-co2-emissions-per-continent.svg 850 × 600; 79 KB
-
 Annual-co2-emissions-per-country.svg 850 × 600; 65 KB
-
 Arctic-death-spiral.jpg 1,024 × 960; 258 KB
-
 ArXiv's yearly submission rate plot.jpg 703 × 608; 71 KB
-
 Canada - Monthly Death Rate (Jul 14, 2023).png 1,577 × 786; 101 KB
-
 Captura de pantalla 2022-04-18 a las 22.07.09.png 698 × 512; 33 KB
-
 Cardiovascular-disease-death-rate-over-time-males-vs-females.png 3,400 × 3,398; 896 KB
-

-
 Chart of publications in quantum physics on arXiv per month.webp 2,163 × 979; 85 KB
-

-
 Chile energy mix.svg 850 × 600; 41 KB
-
 Cited papers by field according to data in OpenAlex.png 1,174 × 1,376; 286 KB
-
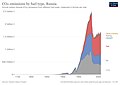 CO2 emissions by fuel type, Russia.jpg 3,400 × 2,400; 156 KB
-
 CO2 emissions Indonesia.svg 850 × 600; 37 KB
-
 CO2 Emissions of France.svg 850 × 600; 44 KB
-
 CO2-by-source (OWID 0142).png 850 × 600; 58 KB
-
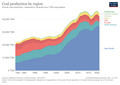 Coal-production-by-region 1981-2020.png 3,400 × 2,400; 565 KB
-
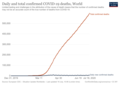 Daily and total confirmed COVID-19 deaths, World.png 3,400 × 2,400; 208 KB
-
 Daily-caloric-supply-derived-from-carbohydrates-protein-and-fat.png 3,400 × 2,400; 468 KB
-
 Deaths-from-aids-un.png 3,400 × 2,400; 283 KB
-
 Drought-severity-index-us (OWID 0278).png 850 × 600; 120 KB
-
 DuckDuckGo Daily Traffic 2010-2020.png 1,378 × 775; 38 KB
-
 Editors English Wikipedia History.png 1,420 × 922; 102 KB
-
 Elec-fossil-nuclear-renewables.svg 850 × 600; 28 KB
-
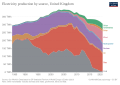
 Electricity production by source, Russia 1985-2020.jpg 1,280 × 903; 68 KB
-
 Electricity-prod-source-stackedUK1985-2020.svg 850 × 600; 37 KB
-
 Electricity-production-by-sourceUK1985-2020.svg 850 × 600; 48 KB
-
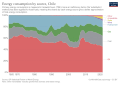
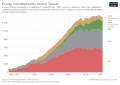 Energy consumption by source, Taiwan.svg 850 × 600; 43 KB
-
 Energy mix Brazil.svg 850 × 600; 46 KB
-
 Energy mix by Germany.jpg 1,052 × 677; 50 KB
-
 Energy mix in China.jpg 1,074 × 678; 47 KB
-
 Energy mix in France.jpg 1,058 × 685; 51 KB
-
 Energy mix in France.svg 850 × 600; 46 KB
-
 Energy mix of Japan.jpg 1,057 × 689; 49 KB
-
 Energy mix of the United Kingdom.jpg 1,040 × 684; 51 KB
-
 Energy mix of UK.svg 850 × 600; 46 KB
-
 Energymix Germany.svg 810 × 400; 157 KB
-
 Estimated PM2.5 fine particle air pollution in Australian study cities in 2001–2020.jpg 2,905 × 4,142; 1.61 MB
-
 External-debt-as-a-share-of-gni.png 3,400 × 2,400; 427 KB
-
 Extreme-one-day-precipitation-usa (OWID 0460).png 850 × 600; 101 KB
-
 Featured picture nominations per month in Wikimedia Commons.svg 1,708 × 811; 101 KB
-
 Fertility rate by State.webp 1,377 × 754; 345 KB
-
 Fish-and-seafood-consumption-per-capita-historical.svg 850 × 600; 69 KB
-

-
 Global aging demographics.webp 1,946 × 894; 96 KB
-
 Global GHG emissions by aggregated sector.png 1,852 × 1,042; 88 KB
-
 Global GHG emissions by sector.jpg 1,852 × 1,042; 216 KB
-
 Global sea level rise from 1992 to 2020, satellite data chart.svg 800 × 540; 59 KB
-
 Global Temperature And Forces.svg 960 × 720; 24 KB
-
 Global-CO2-emissions-from-aviation.png 1,505 × 1,195; 131 KB
-
 Global-malaria-deaths-by-world-region.jpg 3,400 × 2,400; 107 KB
-
 Global-malaria-deaths-by-world-region.png 3,400 × 2,400; 350 KB
-
 Global-malaria-deaths.png 3,400 × 2,400; 351 KB
-
 Global-meat-production-by-livestock-type (OWID 0537).png 850 × 600; 79 KB
-
 Globalmalariadeaths.png 3,400 × 2,400; 351 KB
-
 Graph of suggested editors by week 2020-11-20.png 1,235 × 545; 66 KB
-
 Graph of suggested edits by week 2020-11-21.png 1,237 × 541; 118 KB
-
 High-summer-temp-usa.png 3,400 × 2,400; 936 KB
-

-
 Interventions-ntds-sdgs (2).png 3,400 × 2,784; 515 KB
-
 Key-crop-yields (OWID 0596).png 850 × 600; 87 KB
-
 Land-use-for-vegetable-oil-crops (OWID 0588).png 850 × 600; 76 KB
-
 LEO-SpaceDebris-Nov2020.png 800 × 550; 194 KB
-
 Life expectancy at birth by sex in US, 2000 to 2021.png 874 × 550; 61 KB
-
 Life expectancy in USA by race -all data -ru.png 950 × 726; 114 KB
-
 Life expectancy in USA by race -all data.png 894 × 699; 95 KB
-
 Life expectancy in USA by race -male and female -ru.png 950 × 726; 88 KB
-
 Life expectancy in USA by race -male and female.png 894 × 699; 75 KB
-
 Life expectancy in USA by race -only overall -ru.png 950 × 726; 61 KB
-
 Life expectancy in USA by race -only overall.png 894 × 699; 46 KB
-
 Life expectancy in USA by race -sex gap -ru.png 1,153 × 1,153; 155 KB
-
 Life expectancy in USA by race -sex gap.png 1,081 × 1,081; 131 KB
-
 Linux Distribution Timeline Dec. 2020.svg 3,020 × 12,114; 516 KB
-
 Literacy-rate-of-young-men-and-women-line.png 3,400 × 2,400; 375 KB
-

-
 Long-term-forest-loss-–-Marimekko.png 1,974 × 1,222; 228 KB
-
 Lung-cancer-deaths.png 3,400 × 2,400; 341 KB
-
 Maternal mortality ratio in Pakistan, 1990 to 2020, OWID.png 3,400 × 2,943; 623 KB
-
 Maternal-mortality in Portugal. From 1990 to 2020.png 3,400 × 2,943; 665 KB
-
 Maternal-mortality trends in Pakistan from 1985 to 2020.png 3,400 × 2,943; 632 KB
-
 Mauna Loa Tetrafluoromethane.jpg 1,051 × 791; 259 KB
-
 Microplastics-in-ocean (OWID 0661).png 850 × 600; 71 KB
-
 Moore's Law Transistor Count 1970-2020.png 3,133 × 2,318; 541 KB
-
 Newcomer tasks editors before and after guidance 2020-08-12.png 1,438 × 631; 119 KB
-
 Newcomer tasks editors by week 2020-08-17.png 1,200 × 529; 56 KB
-
 Newcomer tasks edits and users over time 2020-03-15.png 720 × 799; 78 KB
-
 Newcomer tasks edits by week 2020-08-18.png 1,211 × 524; 133 KB
-
 Newcomer tasks funnel by week 2020-08-19.png 659 × 439; 66 KB
-
 Number-of-estimated-paralytic-polio-cases-by-world-region (1).png 3,400 × 2,400; 430 KB
-
 Number-of-neonatal-deaths-by-region.jpg 3,400 × 2,400; 471 KB
-
 Number-of-neonatal-deaths-by-region.png 3,400 × 2,400; 452 KB
-
 Number-requiring-treatment-for-ntds-by-region.png 3,400 × 2,400; 415 KB
-
 Polio in Deutschland 1910-2018.svg 922 × 459; 170 KB
-
 Prevalence-of-severe-food-insecurity-by-region.png 3,400 × 2,400; 388 KB
-
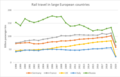 Rail transport in Europe 2020.png 930 × 593; 36 KB
-
 Renewable energy generation, World.jpg 848 × 589; 39 KB
-
 Requiring intervention for NTDs in different countries.png 967 × 432; 32 KB
-
 Scientific Studies by Field (visualization of 2012–2021 OpenAlex data).png 1,182 × 1,389; 288 KB
-
 Share of electricity production by source, Russia.jpg 3,400 × 2,400; 258 KB
-
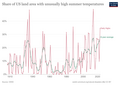 Share of US land area with unusually high summer temperatures, OWID.png 3,400 × 2,400; 926 KB
-
 Share of women married or in a union, OWID.svg 850 × 600; 9 KB
-
 Solar Power Generation.jpg 845 × 590; 41 KB
-
 Suggested edit users by week 2020-06-22.png 1,239 × 543; 47 KB
-
 Suggested edits by week for five wikis 2020-11-30.png 1,233 × 539; 46 KB
-
 Suggested edits by week for ukwiki 2020-11-30.png 1,235 × 542; 43 KB
-
 Suggested edits users by week for five wikis 2020-11-30.png 1,231 × 542; 48 KB
-
 Suggested edits users by week for ukwiki 2020-11-30.png 1,231 × 544; 44 KB
-
 Sulfuryl fluoride concentration.jpg 822 × 376; 54 KB
-
 Temperature reconstruction last two millennia cs.svg 485 × 325; 109 KB
-
 Temperature reconstruction last two millennia.svg 485 × 325; 134 KB
-
 The number of high-intensity interval-training articles published in 2000–2020.png 3,328 × 1,844; 97 KB
-
-
 Total-cases-covid-19 country USA, IRN, FRA, DEU, ITA, CHN ,ESP.svg 850 × 600; 25 KB
-
 Treatment-for-ntds-by-region.png 3,400 × 2,400; 416 KB
-
 Wikipedia article size in gigabytes.png 1,207 × 847; 57 KB
-
 Wildfire-numbers-usa (OWID 1100).png 850 × 600; 51 KB
-
 Wind energy generation by region, OWID-no.svg 850 × 600; 41 KB
-
 Wind power generation.jpg 832 × 571; 46 KB
-
 World Energy mix.jpg 1,032 × 680; 48 KB
-
 World energy mix.svg 850 × 600; 45 KB
.png)
.png)
.png)
.png)


.png)


.png)

.jpg)


.png)


.png)


.png)


.png)


.png)
.png)
.png)


.png)


.png)


.png)


.png)


