Category:Charts showing data through 2015
Jump to navigation
Jump to search
Deutsch: Statistiken bis zu und einschließlich 2015. Viele Grafiken fehlen hier noch – bitte hinzufügen.
English: Charts showing data up to and including 2015.
- Many charts are still missing – please help categorizing charts, e.g. from here. Outdated charts can often be updated. Only charts on notable subjects with specified data source(s) should be included.
Subcategories
This category has the following 2 subcategories, out of 2 total.
E
- EDGAR-FOOD emission data (8 F)
Media in category "Charts showing data through 2015"
The following 98 files are in this category, out of 98 total.
-
 Annual number of births by world region, OWID.svg 850 × 600; 20 KB
-
 Annual number of deaths by age group in England and Wales, OWID.svg 850 × 600; 26 KB
-
 Annual number of deaths by world region, OWID.svg 850 × 600; 20 KB
-
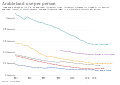 Arable land use per person, OWID.svg 850 × 600; 21 KB
-
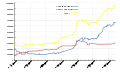
 Billionaire's net worth 2000-2015.png 613 × 348; 29 KB
-
 Biodiversity Europa freshwaters Temporal fluctuations in trend estimates.webp 2,157 × 1,331; 178 KB
-
 Capture-and-aquaculture-production (OWID 0132).png 850 × 600; 60 KB
-
 Capture-fisheries-vs-aquaculture (OWID 0131).png 850 × 600; 67 KB
-
 Catstats.svg 777 × 480; 145 KB
-
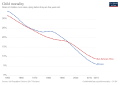 Child mortality in Sub-Saharan Africa and Ethiopia.svg 850 × 600; 25 KB
-
 Computing efficiency, OWID.svg 850 × 600; 6 KB
-
 Cost of sequencing a full human genome, OWID.svg 850 × 600; 5 KB
-
 Cost per Megabase (Mb) of human genome DNA sequencing, OWID.svg 850 × 600; 5 KB
-
 Cumulative global plastics production, OWID.svg 850 × 600; 6 KB
-
 Decline-of-the-worlds-wild-mammals.png 2,615 × 1,924; 269 KB
-
 Direct economic loss attributed to disasters in Senegal from 2005, OWID.png 3,400 × 2,400; 416 KB
-
 Disagreement in the scientific literature by field.jpg 4,152 × 1,248; 440 KB
-
 Drinking water service coverage, OWID.svg 850 × 600; 9 KB
-
 Drinking water services coverage in rural areas, OWID.svg 850 × 600; 8 KB
-
 Drinking water services coverage in urban areas, OWID.svg 850 × 600; 10 KB
-
 Drought Severity Index, OWID.svg 850 × 600; 17 KB
-
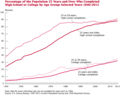 Educational Attainment in the United States 2009.png 787 × 621; 113 KB
-
 Employment by economic sector, OWID.svg 850 × 600; 15 KB
-
 Extreme-Poverty-projection-by-the-World-Bank-to-2030.png 3,000 × 2,100; 248 KB
-
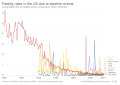 Fatality rates in the US due to weather events, OWID.svg 850 × 600; 31 KB
-
 Fatality-rates-in-the-us-due-to-weather-events (OWID 0456).png 850 × 600; 115 KB
-
 Food-emissions-life-cycle (OWID 0425).png 850 × 600; 90 KB
-
 Global capture fishery production, OWID.svg 850 × 600; 7 KB
-
 Global child mortality over time.png 1,200 × 752; 90 KB
-
 Global famines history.jpg 2,969 × 1,683; 507 KB
-
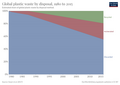
 Global plastic waste by disposal, OWID.svg 850 × 600; 8 KB
-
 Global plastics production, OWID.svg 850 × 600; 8 KB
-
 Global-aquaculture-wild-fish-feed (OWID 0470).png 850 × 600; 77 KB
-
 Global-land-use-since-10000bc (OWID 0541).png 850 × 600; 52 KB
-
 Global-land-use-since-1000bc (OWID 0540).png 850 × 600; 53 KB
-
 Global-plastic-fate (OWID 0534).png 850 × 600; 46 KB
-

-
 Health care cost rise.svg 750 × 440; 15 KB
-
 Health expenditure and financing, per capita, OWID.svg 850 × 600; 19 KB
-
 Historical Index of Human Development, OWID.svg 850 × 600; 14 KB
-
 Income inequality - share of income earned by top 1% 1975 to 2015.png 869 × 765; 256 KB
-

-
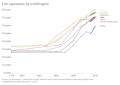
 Internet users by world region, OWID.svg 850 × 600; 12 KB
-

-
 Life Expectancy at birth (OECD data), OWID.svg 850 × 600; 28 KB
-
 Life expectancy by world region, OWID.svg 850 × 600; 15 KB
-
 Long-term price index in food commodities, 1850-2015, OWID.svg 850 × 600; 31 KB
-
 Net-oda-to-ldcs-as-percentage-of-donors-gni.png 3,400 × 2,400; 611 KB
-
 No-slow-down-in-global-warming-NOAA.jpg 900 × 613; 71 KB
-
 Nuclear energy, share of electricity production, OWID.svg 850 × 600; 16 KB
-
 Number of human genome base pairs sequenced per US$, OWID.svg 850 × 600; 5 KB
-
 Number of peer-refereed articles explicitly referring to degrowth.jpg 1,673 × 1,386; 159 KB
-
 Number of people employed in agriculture since 1800, OWID.svg 850 × 600; 15 KB
-

-

-

-

-

-
 Number of world citizens living under different political regimes.png 1,200 × 800; 160 KB
-

-
 Population by broad age group, OWID.svg 850 × 600; 30 KB
-
 Rail modal share.png 854 × 567; 44 KB
-
 Real commodity price index, food products, OWID.svg 850 × 600; 25 KB
-
 Real commodity price index, metals, OWID.svg 850 × 600; 21 KB
-
 Real-commodity-price-index-food-products (OWID 0881).png 850 × 600; 187 KB
-
 Real-commodity-price-index-metals (OWID 0878).png 850 × 600; 145 KB
-
 Renewable-energy-investment.png 3,400 × 2,400; 660 KB
-
 Sales-of-cigarettes-per-adult-per-day (1).svg 4,250 × 3,000; 151 KB
-
 Sanitation facilities coverage in rural areas, OWID.svg 850 × 600; 8 KB
-
 Sanitation facilities coverage in urban areas, OWID.svg 850 × 600; 9 KB
-
 Sanitation facilities coverage, OWID.svg 850 × 600; 9 KB
-
 Seafood production- wild fish catch vs aquaculture, 1, OWID.svg 850 × 600; 8 KB
-
 Seafood production- wild fish catch vs aquaculture, OWID.svg 850 × 600; 10 KB
-
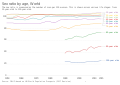 Sex ratio by age, OWID.svg 850 × 600; 15 KB
-
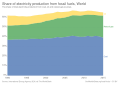 Share of electricity production from fossil fuels, OWID.svg 850 × 600; 8 KB
-

-

-
 Share-of-the-population-living-in-extreme-poverty-in-selected-parts-of-the-world.png 3,400 × 2,400; 550 KB
-
 Social expenditure as share of GDP, OWID.svg 850 × 600; 12 KB
-
 Sulphur oxide (SO₂) emissions, OWID.svg 850 × 600; 23 KB
-
 Sulphur-oxide-emissions (OWID 1066).png 850 × 600; 97 KB
-
 Sunspots-gn-yr-total-smoothed-en.svg 1,000 × 425; 33 KB
-
 Sunspots-reconstructed-0-2015-en-mca.svg 1,000 × 400; 88 KB
-
 Sunspots-reconstructed-0-2015-en.svg 1,000 × 400; 61 KB
-
 Sunspots-reconstructed-0-2015-labels-en.svg 1,000 × 500; 51 KB
-
 The Demographic Transition, OWID.svg 850 × 600; 26 KB
-
 The Slow iPhone Phenomenon.jpg 960 × 684; 171 KB
-
 Top 1% share of net personal wealth (WID 2018), OWID.svg 850 × 600; 24 KB
-
 Top 5% income share, OWID.svg 850 × 600; 14 KB
-
 Total-population-living-in-extreme-poverty-by-world-region.png 3,400 × 2,400; 619 KB
-
 Transport Energy Consumption in Europe.png 4,017 × 4,158; 236 KB
-
 US Crude Oil Production and Imports.svg 750 × 540; 22 KB
-
 US education expenditure as share of GDP, OWID.svg 850 × 600; 8 KB
-
 Wild-fish-allocation (OWID 1103).png 850 × 600; 56 KB
-
 World population living in extreme poverty - Our World in Data - 2015.png 1,200 × 800; 105 KB
-

-
 World-Population-Growth-1750-2100.png 3,000 × 2,100; 236 KB
-
 World-population-in-extreme-poverty-absolute.svg 850 × 600; 11 KB


.png)
.png)


_of_human_genome_DNA_sequencing,_OWID.svg)


.png)
.png)


.png)
.png)
.png)
.png)
,_OWID.svg)


_and_number_of_monthly_Google_searches_for_degrowth_(b).jpg)


,_OWID.svg)


,_OWID.svg)


.png)
.png)

.svg)


_emissions,_OWID.svg)
.png)


,_OWID.svg)


.png)

),_OWID.svg)

