Category:Charts showing data through 2017
Jump to navigation
Jump to search
Deutsch: Statistiken bis zu und einschließlich 2017. Viele Grafiken fehlen hier noch – bitte hinzufügen.
English: Charts showing data up to and including 2017.
- Many charts are still missing – please help categorizing charts, e.g. from here. Outdated charts can often be updated. Only charts on notable subjects with specified data source(s) should be included.
Subcategories
This category has only the following subcategory.
Media in category "Charts showing data through 2017"
The following 145 files are in this category, out of 145 total.
-

-

-

-
 20171231 Climate spiral (HadCRUT4.6 1850- ) Ed Hawkins.gif 749 × 790; 591 KB
-
 20190729 Warming stripes (circular) - global (1900-2017) - Emanuele Bevacqua.jpg 3,200 × 3,200; 731 KB
-
 20210125 The Cryosphere - Floating and grounded ice - imbalance - climate change.png 1,889 × 1,288; 61 KB
-
 Active editors on Persian Wikipedia over time.png 640 × 240; 31 KB
-
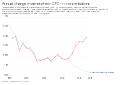 Annual change in atmospheric CFC-11 concentrations, OWID.svg 850 × 600; 6 KB
-
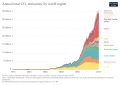
 Annual total CO₂ emissions, by world region, OWID.svg 850 × 600; 108 KB
-
 Antarctic ozone hole area, OWID.svg 850 × 600; 8 KB
-
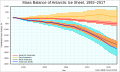 Antarctica massbalance IMBIE2018-en.svg 1,000 × 600; 168 KB
-
 Argentina, uso de plaguicidas por hectárea cultivada, 1990-2017.svg 850 × 600; 34 KB
-
 Average acres burned per wildfire in the United States, OWID.svg 850 × 600; 9 KB
-
 Average working hours per worker.png 1,299 × 917; 159 KB
-

-
 Breakdown of child mortality by cause, OWID.svg 850 × 600; 9 KB
-
 Broadband subscriptions per 100 people, OWID.svg 850 × 600; 11 KB
-
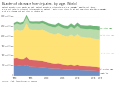 Burden of disease from injuries, by age, OWID.svg 850 × 600; 11 KB
-
 Burden of disease, by age group, OWID.svg 850 × 600; 17 KB
-
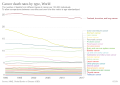 Cancer death rates by type, OWID.svg 850 × 600; 20 KB
-
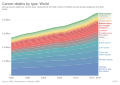 Cancer deaths by type, OWID.svg 850 × 600; 45 KB
-
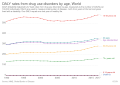
 Cardiovascular disease death rates by age, OWID.svg 850 × 600; 17 KB
-
 Child deaths in the 1st year of life, OWID.svg 850 × 600; 8 KB
-
 Child mortality by sex, OWID.svg 850 × 600; 6 KB
-
-
 CO₂ emissions by fuel type, OWID.svg 850 × 600; 50 KB
-
 Crude birth rate and death rate over time in England and Wales.svg 3,058 × 2,230; 20 KB
-
 DALY rates from alcohol use disorders by age, OWID.svg 850 × 600; 14 KB
-
 DALY rates from anxiety disorders by age, OWID.svg 850 × 600; 17 KB
-
 DALY rates from bipolar disorder by age, OWID.svg 850 × 600; 16 KB
-
 DALY rates from drug use disorders by age, OWID.svg 850 × 600; 17 KB
-
 DALY rates from schizophrenia by age, OWID.svg 850 × 600; 14 KB
-
 DALYs from eating disorders by age, OWID.svg 850 × 600; 15 KB
-
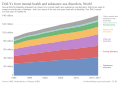
 DALYs from mental health and substance use disorder by age, OWID.svg 850 × 600; 18 KB
-
 DALYs from mental health and substance use disorders, OWID.svg 850 × 600; 15 KB
-
 DALYs rate from all causes – Nepal & World, OWID.png 3,400 × 2,400; 380 KB
-
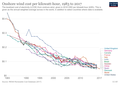
 Death rate by cause, OWID.svg 850 × 600; 8 KB
-
 Death rate from tuberculosis, by age, OWID.svg 850 × 600; 12 KB
-
 Death rates by broad cause category, OWID.svg 850 × 600; 15 KB
-
 Death rates from air pollution, OWID.svg 850 × 600; 8 KB
-
 Death rates from natural disasters, OWID.svg 850 × 600; 13 KB
-
 Deaths by age, OWID.svg 850 × 600; 11 KB
-
 Deaths by cause, OWID.svg 850 × 600; 8 KB
-
 Deaths from cancer, by age, OWID.svg 850 × 600; 11 KB
-
 Deaths from cardiovascular diseases, by age, OWID.svg 850 × 600; 12 KB
-
 Deaths from drowning, by age, OWID.svg 850 × 600; 11 KB
-
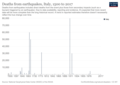 Deaths from earthquakes in Italy (1500-2017).png 3,400 × 2,400; 446 KB
-
 Deaths from fire, by age, OWID.svg 850 × 600; 11 KB
-
 Deaths from homicide, by age, OWID.svg 850 × 600; 11 KB
-
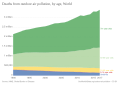
 Deaths from outdoor air pollution by region, OWID.svg 850 × 600; 17 KB
-
 Deaths from outdoor air pollution, by age, OWID.svg 850 × 600; 11 KB
-
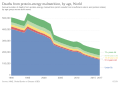 Deaths from protein-energy malnutrition, by age, OWID.svg 850 × 600; 12 KB
-
 Deaths from road incidents, by age, OWID.svg 850 × 600; 11 KB
-
 Deaths from stroke, by age, OWID.svg 850 × 600; 13 KB
-
 Deaths from substance use disorders by age, OWID.svg 850 × 600; 12 KB
-
 Deaths from substance use disorders, OWID.svg 850 × 600; 7 KB
-
 Deaths from suicide, by age, OWID.svg 850 × 600; 9 KB
-
 Deaths from tuberculosis, by age, OWID.svg 850 × 600; 11 KB
-
 Deaths from vulcanic eruptions in Italy (141 BCE-2017).png 3,400 × 2,400; 497 KB
-
 Depressive disorder DALY rates by age, OWID.svg 850 × 600; 16 KB
-
 Development assistance allocated to health causes, OWID.svg 850 × 600; 21 KB
-
 Development of extreme poverty in India.jpg 1,029 × 650; 43 KB
-
 Disease burden by age, OWID.svg 850 × 600; 11 KB
-

-
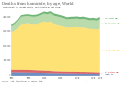
 Disease burden from injuries, OWID.svg 850 × 600; 19 KB
-
 Disease burden from non-communicable diseases by age, OWID.svg 850 × 600; 11 KB
-
 Earthquake-deaths.png 3,400 × 2,400; 621 KB
-
 Economic-losses-from-disasters-share-gdp.png 3,400 × 2,400; 756 KB
-
 Extensively drug-resistant tuberculosis, OWID.svg 850 × 600; 7 KB
-
 Fire death rates by age, OWID.svg 850 × 600; 17 KB
-
 Fish-stocks-by-region (OWID 0431).png 850 × 600; 81 KB
-
 Fish-stocks-within-sustainable-levels (OWID 0429).png 850 × 600; 58 KB
-
 Frequency of North Atlantic hurricanes, OWID.svg 850 × 600; 22 KB
-
 Frequency-north-atlantic-hurricanes (OWID 0393).png 850 × 600; 175 KB
-
 Global annual CO2 emissions by world region since 1750.svg 850 × 600; 121 KB
-
 Global disaster losses as a share of GDP, OWID.svg 850 × 600; 8 KB
-
 Global disease burden by region, OWID.svg 850 × 600; 23 KB
-
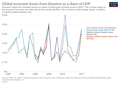
 Global economic losses from disasters as a share of GDP, OWID.svg 850 × 600; 12 KB
-
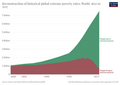
 Global hydroelectric power consumption, terawatt-hours, OWID.svg 850 × 600; 8 KB
-
 Global onshore wind installed project costs, OWID.svg 850 × 600; 10 KB
-
 Global primary energy consumption by source, OWID.svg 850 × 600; 13 KB
-
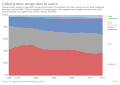 Global primary energy share by source, OWID.svg 850 × 600; 23 KB
-
 Global renewable energy consumption, OWID.svg 850 × 600; 16 KB
-
 Global weather disaster losses as a share of GDP, OWID.svg 850 × 600; 8 KB
-
 Global-disaster-losses-gdp-share.png 3,400 × 2,400; 414 KB
-
 Grafikoak Ukrania eta Luxenburgo.png 1,274 × 379; 125 KB
-
 GWAS Participant Ancestry over Time, 2007–2017.webp 2,023 × 923; 108 KB
-
 Homicide rates in Cyprus (1990-2017).png 1,697 × 1,101; 117 KB
-
 Household air pollution deaths by region, OWID.svg 850 × 600; 23 KB
-
 Hurricane landfalls in the United States, OWID.svg 850 × 600; 83 KB
-
 Hurricane-landfalls-us (OWID 0508).png 850 × 600; 84 KB
-
 Hurricane-track-error (OWID 0507).png 850 × 600; 85 KB
-
 Imports of goods and services (constant 2010 US $), 1970 to 2017.png 3,400 × 2,400; 227 KB
-
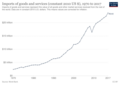
 Imports of goods and services (constant 2010 US $), OWID.svg 850 × 600; 21 KB
-
 Income inequality in Latin America, OWID.svg 850 × 600; 18 KB
-
 Internet users per 100 inhabitants ITU.svg 600 × 480; 40 KB
-
 Luxenburgo eta Ukrainaren giza garapenerako indizeak.png 971 × 565; 39 KB
-
 Material-footprint-per-capita.png 3,400 × 2,400; 261 KB
-
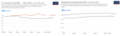
 Military expenditure (% of GDP), OWID.svg 850 × 600; 26 KB
-
 Military expenditure as share of GDP, OWID.svg 850 × 600; 14 KB
-
 Moore's Law - Transistors per microprocessor, OWID.svg 850 × 600; 6 KB
-
 Motor vehicle, motorcyclist, cyclist and pedestrian deaths, OWID.svg 850 × 600; 12 KB
-
 MwInstallati.jpg 974 × 571; 73 KB
-
 Natural disaster deaths in Bangladesh from 1990, OWID.png 3,400 × 2,400; 369 KB
-
 NEA by survey (1995-2017).svg 720 × 400; 28 KB
-
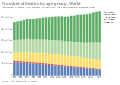 Number of deaths by age group, OWID.svg 850 × 600; 23 KB
-
 Number of deaths from alcohol and drug use disorders, OWID.svg 850 × 600; 7 KB
-
 Number of deaths from earthquakes, OWID.svg 850 × 600; 20 KB
-
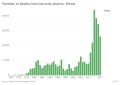 Number of deaths from terrorist attacks, OWID.svg 850 × 600; 10 KB
-
 Number of deaths from volcanic eruptions, OWID.svg 850 × 600; 14 KB
-

-

-
 Number of people with alcohol use disorders by region, OWID.svg 850 × 600; 25 KB
-
 Number of people with alcohol use disorders, OWID.svg 850 × 600; 6 KB
-

-
 Number of wildfires in the United States, OWID.svg 850 × 600; 8 KB
-
 Number-of-people-with-cancer-by-age.png 3,400 × 2,400; 354 KB
-
 Onshore wind cost per kilowatt-hour, OWID.svg 850 × 600; 27 KB
-
 Onshore-wind-lcoe.png 3,400 × 2,400; 669 KB
-
 Per capita CO2 emissions, Greece.png 1,442 × 976; 158 KB
-
 Population by income level (World Bank), OWID.svg 850 × 600; 13 KB
-
 Population curve.svg 547 × 332; 10 KB
-
 Prevalence of eating disorders by age, OWID.svg 850 × 600; 24 KB
-
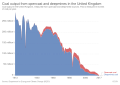
 Primary energy mix in the United Kingdom, OWID.svg 850 × 600; 20 KB
-
 Protected area, marine and terrestrial, OWID.svg 850 × 600; 4 KB
-
-
 Road traffic deaths, OWID.svg 850 × 600; 7 KB
-
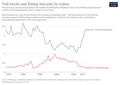
 Share of food products in total merchandise exports, OWID.svg 850 × 600; 18 KB
-
 Share of schools with access to basic drinking water, OWID.svg 850 × 600; 6 KB
-
 Stateofthecommons2017-o.svg 354 × 484; 49 KB
-
 Supercomputer Power (FLOPS), OWID.svg 850 × 600; 6 KB
-
 Terrorism deaths per year by country.jpg 1,636 × 869; 294 KB
-
 The growth of genome-wide association studies (GWAS), 2007–2017.webp 2,018 × 1,315; 190 KB
-
 Top marginal income tax rate, OWID.svg 850 × 600; 48 KB
-
 Total disease burden by cause, OWID.svg 850 × 600; 8 KB
-
-
 Total number of deaths by cause category, OWID.svg 850 × 600; 15 KB
-
 Total-disease-burden-by-cause-relative.png 3,400 × 2,400; 397 KB
-
 Track error, OWID.svg 850 × 600; 12 KB
-
 Transistores-microprocesador.png 970 × 603; 13 KB
-
 Uso de plaguicidas por toneladas Argentina, 1990 a 2017.svg 850 × 600; 33 KB
-
 Weather-losses-share-gdp (OWID 1110).png 850 × 600; 61 KB
-
 WHO surveillance vs. GBD incidence of tetanus, OWID.svg 850 × 600; 10 KB
-
 WHO vs. IHME incidence of tetanus, OWID.svg 850 × 600; 8 KB
-


_2017_SCREENSHOT_-_Ed_Hawkins.png)
_Ed_Hawkins.gif)
_-_global_(1900-2017)_-_Emanuele_Bevacqua.jpg)


.png)


.png)


.png)
.png)

.png)


.png)


.png)
.png)
,_1970_to_2017.png)
,_OWID.svg)


,_OWID.svg)


.svg)


),_OWID.svg)


,_OWID.svg)


,_OWID.svg)


.png)


,_OWID.svg)

,_2007%E2%80%932017.webp)


.png)


,_OWID.svg)
.png)