Category:Charts showing data through 2010
Jump to navigation
Jump to search
Deutsch: Statistiken bis zu und einschließlich 2010. Viele Grafiken fehlen hier noch – bitte hinzufügen.
English: Charts showing data up to and including 2010.
- Many charts are still missing – please help categorizing charts, e.g. from here. Outdated charts can often be updated. Only charts on notable subjects with specified data source(s) should be included.
Media in category "Charts showing data through 2010"
The following 30 files are in this category, out of 30 total.
-
 Carbon dioxide emissions by sector, OWID.svg 850 × 600; 14 KB
-
 Chinese Pork Production and Consumption (11718363396).jpg 1,651 × 901; 211 KB
-
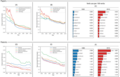
 Connected by race.png 893 × 845; 90 KB
-
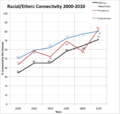
 Connectivity over time.png 749 × 930; 63 KB
-
 Decline in the diversity of language used in science and technology paper titles.png 1,681 × 1,075; 413 KB
-
 Decline of disruptive science and technology (based on the CD index).png 1,172 × 1,204; 179 KB
-
 Demographic-Transition-5-countries.png 2,999 × 2,025; 413 KB
-
 Diversity of language use in science and technology over time.png 1,411 × 718; 140 KB
-
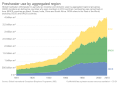 Freshwater use by aggregated region, OWID.svg 850 × 600; 16 KB
-
 Global fishery catch by sector, OWID.svg 850 × 600; 16 KB
-
 Global sea surface and land-air temperature anomalies since 1850.webp 1,057 × 1,193; 155 KB
-
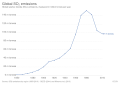 Global SO₂ emissions, OWID.svg 850 × 600; 5 KB
-
 Global sulphur dioxide (SO₂) emissions by world region, OWID.svg 850 × 600; 10 KB
-
 Global wild fishery catch by sector, OWID.svg 850 × 600; 20 KB
-
 Global-agri-productivity-growth (OWID 0473).png 850 × 600; 82 KB
-
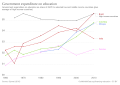 Government expenditure on education, OWID.svg 850 × 600; 9 KB
-
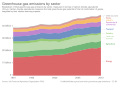 Greenhouse gas emissions by sector, OWID.svg 850 × 600; 15 KB
-
 Land-use-agriculture-longterm (OWID 0589).png 850 × 600; 45 KB
-
 Main taxes in Switzerland from 1990 - 2010.JPG 1,024 × 747; 60 KB
-
 Nitrous oxide emissions by sector, OWID.svg 850 × 600; 18 KB
-
 Octopus capture.png 556 × 307; 52 KB
-

-
 Población porcentaje.jpg 2,999 × 2,249; 519 KB
-
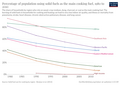 Population-using-solid-fuels-for-cooking (OWID 0820).png 850 × 600; 83 KB
-
 So-emissions-by-world-region-in-million-tonnes (OWID 0972).png 850 × 600; 78 KB
-
 Temp anomalies 2000yrs pages2k-en.svg 1,065 × 425; 4.8 MB
-
 Vandal revert trend.by year.png 1,024 × 768; 35 KB
-
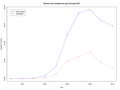
 Whales-killed-per-decade (OWID 1106).png 850 × 600; 50 KB
-
 Wikipedia compared with other media outlets 2010.png 861 × 621; 140 KB
-
 Wikipedia growth.png 835 × 525; 16 KB

.jpg)


.png)


_emissions_by_world_region,_OWID.svg)

.png)


.png)


.png)
.png)

.png)

