Category:RCraig09 charts showing data through 2019
Jump to navigation
Jump to search
English: Charts uploaded by User:RCraig09 showing data through 2019—used for tracking which charts may be due for updating.
Media in category "RCraig09 charts showing data through 2019"
The following 12 files are in this category, out of 12 total.
-
 1907- Income inequality and union participation.svg 1,000 × 750; 8 KB
-
 2012- U.S. gun murder victims by weapon (FBI UCR).png 2,700 × 1,720; 115 KB
-
 2019 Carbon dioxide emissions by income group - Oxfam data.svg 1,200 × 850; 3 KB
-
 20190114 Illegal immigration - removals and returns.png 2,028 × 1,232; 62 KB
-
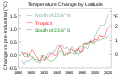 20200314 Temperature changes for three latitude bands (5MA, 1880- ) GISS.svg 1,000 × 643; 72 KB
-

-
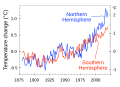
 20200505 Global warming variability - global vs Caribbean.svg 835 × 600; 150 KB
-
-

-
 20201112 Tidal flooding graph - Annapolis, Maryland.svg 900 × 675; 2 KB
-
-
 Scientific consensus - Earth's climate is warming (Temperature Anomaly ℃).png 3,071 × 1,790; 927 KB

.png)


_GISS.svg)
.svg)


.gif)


.png)