Category:Geological maps of the United States
Jump to navigation
Jump to search
Countries of the Americas: Argentina · Belize · Bolivia · Brazil · Canada · Chile · Colombia · Costa Rica · Ecuador · El Salvador · Guatemala · Mexico · Nicaragua · Panama · Paraguay · Peru · United States of America · Uruguay · Venezuela
Other areas: French Guiana · Greenland · Guadeloupe · Martinique · Puerto Rico
Other areas: French Guiana · Greenland · Guadeloupe · Martinique · Puerto Rico
Subcategories
This category has the following 19 subcategories, out of 19 total.
Media in category "Geological maps of the United States"
The following 160 files are in this category, out of 160 total.
-
2024 United States landslide map.jpg 4,063 × 2,917; 2.58 MB
-
5356 1.md.gif 250 × 241; 29 KB
-
AmCyc Coal - United States fields.jpg 3,545 × 2,557; 3.54 MB
-
Geologic Map for the Anadarko Basin.png 1,013 × 795; 194 KB
-
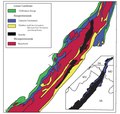
Animikie Group and Marquette Range and Huronian supergroups.PNG 386 × 436; 59 KB
-
Animikie Group, Marquette Range and Huronian supergroups2.PNG 692 × 776; 183 KB
-
Appalachian map de.svg 402 × 556; 49 KB
-
Appalachian map.jpg 432 × 613; 31 KB
-
Appalachian map.svg 402 × 556; 59 KB
-
Approximate area of the Niagara Escarpment 2.PNG 514 × 458; 30 KB
-
Atlantic Plain Continental Shelf.jpg 846 × 767; 158 KB
-
Bulletin of the Geological Society of America (1904) (19827163654).jpg 2,632 × 3,890; 1.59 MB
-
Cape Final Area - Flickr - brewbooks.jpg 3,264 × 2,448; 4.88 MB
-
Cape Royal and Angels Window - Flickr - brewbooks.jpg 3,264 × 2,448; 5.42 MB
-
Cape Royal and Beaver Sand Bar - Flickr - brewbooks.jpg 3,264 × 2,448; 3.56 MB
-
Cascade Volcanic Arc.jpg 461 × 686; 84 KB
-
Cascadia subduction zone USGS He.jpg 378 × 552; 40 KB
-
Cascadia subduction zone USGS.png 495 × 706; 23 KB
-
CatoctinFormationMap2.pdf 1,275 × 1,208; 406 KB
-
Cheops Pyramid - Flickr - brewbooks.jpg 3,264 × 2,448; 5.48 MB
-
Citronelle Formation geologic map.png 1,017 × 570; 507 KB
-
Colorado River and Bright Angel - Flickr - brewbooks.jpg 3,264 × 2,448; 5.17 MB
-
Conventional gas production in the United States, 2008.jpg 2,200 × 1,300; 2 MB
-
CZSedBasins.pdf 2,550 × 1,650; 2.3 MB
-
Distribution of loess in North America.gif 412 × 444; 44 KB
-
1916 Irondale epicenter map.png 331 × 426; 96 KB
-
2010 Illinois earthquake map.jpg 612 × 718; 117 KB
-
Arkansas swarm.png 750 × 572; 549 KB
-
Illinois earthquake intensity 18 Apr 2008.jpg 612 × 721; 147 KB
-
Loma Prieta earthquake Isoseismal Map.gif 635 × 772; 52 KB
-
New Madrid quakes.png 300 × 351; 82 KB
-
New Madrid Seismic Zone activity 1974-2011.svg 747 × 788; 1.73 MB
-
NMSZ Erdbeben.jpg 432 × 475; 81 KB
-
NMSZ Vergleich.jpg 437 × 281; 37 KB
-
USGS 2011 Oklahoma intensity.jpg 612 × 724; 146 KB
-
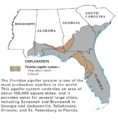
Floridan Aquifer USGS.gif 402 × 408; 19 KB
-
FMIB 39498 Map showing old channel and mouth of the Hudson.jpeg 536 × 855; 132 KB
-
General Distribution of Erosion - NARA - 140696186.jpg 12,608 × 8,444; 5.38 MB
-
General Distribution of Erosion - NARA - 140696188.jpg 10,240 × 6,965; 4.62 MB
-
Generalized Map of Soil Erosion in the United States - NARA - 140696194.jpg 13,216 × 10,243; 8.44 MB
-
Geologic Map of the Grand Canyon 30 x 60.jpg 580 × 420; 91 KB
-
Geothermal heat map US.png 1,892 × 1,247; 65 KB
-
Geothermal springs map US.png 887 × 387; 78 KB
-
GNIS map Branch vs. Run vs. Brook (4134813569).jpg 956 × 661; 209 KB
-
GNIS map Coulee vs. Bayou (4134811651).jpg 956 × 661; 131 KB
-
GNIS map Lake vs. Pond (4135570896).jpg 956 × 661; 301 KB
-
Gnis.mesa-butte-knobs.jpg 956 × 661; 225 KB
-
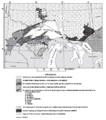
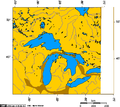
Great Lakes Tectonic Zone map.PNG 233 × 104; 6 KB
-
Grenville extent.gif 1,110 × 890; 91 KB
-
Grouse Creek Block Location.jpg 563 × 523; 185 KB
-
Grouse Creek block location.jpg 1,131 × 1,206; 576 KB
-
Inner Gorge and Great Unconformity - Flickr - brewbooks (1).jpg 3,264 × 2,448; 4.09 MB
-
Inner Gorge and Great Unconformity - Flickr - brewbooks.jpg 3,264 × 2,448; 3.76 MB
-
Isis Temple - Flickr - brewbooks.jpg 3,264 × 2,448; 5.08 MB
-
Juan de fuca plate.png 536 × 652; 46 KB
-
Juan de fuca ridge-south-map-usgs.png 424 × 520; 12 KB
-
Landkarte New Madrid Erdbeben.jpg 467 × 474; 42 KB
-
Level IV ecoregions, Northern Basin and Range.png 2,184 × 1,018; 1.28 MB
-
Level IV ecoregions, Pacific Northwest.png 2,090 × 2,208; 4.81 MB
-
Lower 48 shale plays by geologic age (17046841810).png 570 × 288; 190 KB
-
Map of salt domes in the gulf coastal plain.jpg 2,639 × 1,471; 684 KB
-
Map of the Navajo Volcanic Fields.jpg 1,280 × 1,467; 568 KB
-
Map of Washington, Oregon and Idaho geological deposits.jpeg 900 × 634; 315 KB
-
Mapa-geologico-yellowstone.png 3,072 × 2,479; 6.71 MB
-
Marcellus Bedrock.pdf 900 × 900; 74 KB
-
Marcellus Bedrock.svg 540 × 540; 1.21 MB
-
Marcellus Bedrock2.svg 540 × 540; 341 KB
-
Marcellus Shale Gas Play.png 850 × 1,100; 1 MB
-
Marcellus Shale USGS.png 300 × 350; 78 KB
-
Marcellus Thermal Maturity.png 1,766 × 2,988; 442 KB
-
Miss lobe.jpg 2,169 × 1,682; 1.08 MB
-
Mississippi Embayment Structural Map.png 682 × 568; 107 KB
-
Mississippi Embayment Top Cretaceous Contour Map.png 1,199 × 1,000; 773 KB
-
Moraine systems.png 859 × 608; 211 KB
-
National-Map 0.jpg 2,250 × 1,500; 947 KB
-
New Madrid and Wabash seizmic zones-USGS.png 748 × 819; 467 KB
-
Niagara Escarpment map.png 931 × 535; 29 KB
-
NIE 1905 Coal - coal fields in the United States.jpg 2,481 × 1,560; 1.09 MB
-
NIE 1905 Petroleum - gas and petroleum fields in the United States.jpg 2,471 × 1,554; 1.26 MB
-
NIE 1905 United States - Gold, Silver and Copper.jpg 2,480 × 1,560; 1.3 MB
-
North america and scandinavia basement rocks.png 484 × 429; 15 KB
-
North American provinces and orogens.PNG 497 × 583; 237 KB
-
Nuttall geologic map.jpg 1,423 × 889; 304 KB
-
Ouachita Orogeny geologic map.png 571 × 443; 69 KB
-
Palisades Sill Location Map.jpg 634 × 460; 85 KB
-
Phantom Fault - Flickr - brewbooks (1).jpg 3,264 × 2,448; 4.87 MB
-
Physio-al.jpg 230 × 353; 74 KB
-
Physiographic Provinces 48 Conterminous US-v1.svg 1,000 × 600; 2.05 MB
-
Physiographic provinces of the Mid-Atlantic region by NPS.png 973 × 741; 271 KB
-
Pittsburgh-1-.pdf 5,400 × 9,000; 11.87 MB
-
Pittsmall.gif 384 × 526; 25 KB
-
Plan view Late Precambrian-Cambrian rifted margin.jpg 750 × 588; 122 KB
-
Point Imperial - Flickr - brewbooks.jpg 3,264 × 2,448; 5.04 MB
-
PSM V38 D764 Effect of the glacial dam at cincinnati.jpg 2,556 × 1,546; 412 KB
-
San Juan Basin Base Map.pdf 1,412 × 1,462; 86 KB
-
Sanandreas.jpg 362 × 500; 50 KB
-
Scotts Bluff National Monument geologic map.jpg 897 × 824; 203 KB
-
SE-USshoreline.svg 791 × 653; 25 KB
-
SebagoGranite Map.png 316 × 526; 32 KB
-
Seismic Hazard Zones in the United States..pdf 1,650 × 1,275; 460 KB
-
Seismic Hazard Zones In The United States.pdf 1,650 × 1,275; 455 KB
-
Shaleusa2.jpg 1,100 × 850; 169 KB
-
Soils, their properties and management (1915) (14760359541).jpg 3,068 × 2,180; 1.08 MB
-
South Central US Sedimentary Basins.tif 2,657 × 3,106; 32.04 MB
-
South Rim - Bright Angel Fault - Flickr - brewbooks (1).jpg 3,264 × 2,448; 3.52 MB
-
South Rim - Bright Angel Fault - Flickr - brewbooks.jpg 3,264 × 2,448; 4.67 MB
-
Southwestern US Sedimentary Basins.tif 5,067 × 4,133; 80.44 MB
-
St. Croix geologic map.png 611 × 245; 96 KB
-
Superior upland.jpg 400 × 302; 40 KB
-
Tacoma Fault and Basin.png 366 × 254; 457 KB
-
Terminal Moraines (4843409289).jpg 2,120 × 3,267; 633 KB
-
Teton region in the Early Ordovician.jpg 507 × 385; 33 KB
-
Teton region in the Late Cambrian.jpg 492 × 356; 25 KB
-
Teton region in the Lower Cambrian.jpg 481 × 309; 27 KB
-
Texas Coastline Through Time.png 858 × 504; 69 KB
-
The American journal of science (1921) (17527895174).jpg 3,456 × 2,140; 1.74 MB
-
The Crystal Falls iron-bearing district of Michigan (1899) (20091627914).jpg 3,299 × 2,719; 810 KB
-
The new international encyclopaedia (1905) (14778762971).jpg 2,480 × 1,576; 472 KB
-
The Onondaga Formation.png 3,162 × 2,405; 166 KB
-
Thickness map of the Utica formation (26191453814).jpg 3,507 × 2,480; 798 KB
-
Tinley Moraine in Indiana (wrkng).jpg 748 × 829; 72 KB
-
TMP map.png 576 × 573; 336 KB
-
Uinta Basin map.png 976 × 561; 77 KB
-
Uncle Jim Point - Flickr - brewbooks (1).jpg 3,264 × 2,448; 4.93 MB
-
Uncle Jim Point - Flickr - brewbooks.jpg 3,264 × 2,448; 5.12 MB
-
United States Shale gas plays, May 2011.pdf 1,650 × 1,275; 386 KB
-
US Conterminous 48 Physiographic Divisions v1.svg 820 × 570; 2.12 MB
-
US cretaceous general.jpg 500 × 338; 20 KB
-
US east coast middle appalachian physio map.jpg 343 × 474; 72 KB
-
US east coast ne appalachian physio map.jpg 269 × 500; 39 KB
-
US east coast physiographic regions map.jpg 229 × 364; 18 KB
-
US flood map 2008-06-10.jpg 529 × 364; 65 KB
-
US Geological Provinces.gif 1,190 × 740; 195 KB
-
US Geological Provinces.png 628 × 372; 289 KB
-
US ground conductivity map.webp 11,671 × 3,223; 114.39 MB
-
US pennsylvanian general USGS.jpg 500 × 353; 22 KB
-
US physiographic map.jpg 512 × 320; 51 KB
-
US-reserves-USGS.png 719 × 501; 654 KB
-
USGS deep wells 1997.png 1,108 × 665; 276 KB
-
USGS geologic map St John USVI.png 872 × 1,099; 217 KB
-
USGS Isle Royale geologic map.png 1,440 × 877; 1.04 MB
-
USGS map of Galena mines.jpg 1,099 × 751; 247 KB
-
USGS map of the Mother Lode belt in California.jpg 719 × 766; 131 KB
-
USGS NE Isle Royale geologic map.png 1,181 × 870; 1.13 MB
-
USGSBulletin1291 mapofUS MiddlePennTime.png 981 × 654; 451 KB
-
Vista Encantada - Flickr - brewbooks.jpg 3,264 × 2,448; 5.39 MB
-
WestcoastSeaplates.svg 878 × 666; 106 KB
-
WillistonBasinLocation.jpg 650 × 800; 52 KB


