Category:Demographic maps of the United States
Jump to navigation
Jump to search
Subcategories
This category has the following 16 subcategories, out of 16 total.
Media in category "Demographic maps of the United States"
The following 200 files are in this category, out of 206 total.
(previous page) (next page)-
 % Population Change by state from 2010 - 2019.jpg 5,400 × 3,586; 3 MB
-
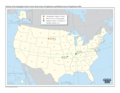
 2001-2005 imm rate US.PNG 1,357 × 624; 58 KB
-
 200x200w-logo.png 200 × 200; 42 KB
-
 2020 Census - Majority-Black Counties in the United States.png 7,000 × 4,000; 3.63 MB
-
 2020 United States urban areas.svg 1,052 × 744; 51.27 MB
-

-
 AB Members in Prisons of States US MAP.jpg 800 × 644; 57 KB
-
 Agreeableness by state.jpg 390 × 314; 16 KB
-
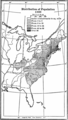
 American Population (Foreign emigration), 1880.jpg 1,024 × 651; 168 KB
-
 Americans under the age of 18 by county.png 7,500 × 4,000; 5.16 MB
-
 Americans under the age of 5 by county.png 7,500 × 4,000; 4.83 MB
-
 Americans with a bachelor's degree or higher by state.svg 1,199 × 593; 73 KB
-
 Americans with a high school education or higher by state.svg 1,199 × 593; 73 KB
-
 Americans with an advanced degree by state.svg 1,199 × 593; 72 KB
-
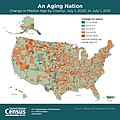 An Aging Nation - Change In Median Age by County - July 1, 2020, to July 1, 2021.jpg 1,080 × 1,080; 239 KB
-
 An Aging Nation - Median Age by County - July 1, 2021.jpg 1,080 × 1,080; 238 KB
-
 Asian Americans 1860 County.png 7,750 × 4,650; 3.78 MB
-
 Asian Americans 1870 County.png 7,750 × 4,650; 6.83 MB
-
 Asian Americans 1880 County.png 7,750 × 4,650; 7.36 MB
-
 Asian Americans 1890 County.png 7,750 × 4,650; 9.02 MB
-
 Asian Americans 1990 County.png 7,750 × 4,650; 8.64 MB
-
 Asian Americans 2000 County.png 7,750 × 4,650; 8.64 MB
-
 Asian Americans 2010 County.png 7,750 × 4,650; 8.59 MB
-
 Asian Americans 2020 County.png 7,750 × 4,650; 8.71 MB
-
 Birth Rates by State (2021).svg 959 × 593; 299 KB
-
 Bivariate.png 917 × 633; 275 KB
-
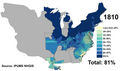
 Black American 1810 County.png 14,950 × 8,865; 4.6 MB
-
 Black Americans 1790 County.png 10,218 × 8,273; 2.93 MB
-
 Black Americans 1800 County.png 10,218 × 8,500; 3.63 MB
-
 Black Americans 1820 County.png 14,818 × 9,000; 5.31 MB
-
 Black Americans 1830 County.png 13,100 × 8,800; 4.96 MB
-
 Black Americans 1840 County.png 13,210 × 8,900; 5.51 MB
-
 Black Americans 1850 County.png 15,610 × 8,900; 6.92 MB
-
 Black Americans 1860 County.png 15,610 × 8,900; 7.82 MB
-
 Black Americans 1870 County.png 15,610 × 8,900; 8.64 MB
-
 Black Americans 1880 County.png 15,610 × 8,900; 16.18 MB
-
 Black Americans 1890 County.png 15,610 × 8,900; 17.06 MB
-
 Black Americans 1900 County.png 15,610 × 8,900; 17.25 MB
-
 Black Americans 1910 County.png 15,610 × 8,900; 10.39 MB
-
 Black Americans 1920 County.png 15,610 × 8,900; 18.74 MB
-
 Black Americans 1930 County.png 15,610 × 8,900; 11.49 MB
-
 Black Americans 1940 County.png 15,610 × 8,900; 11.5 MB
-
 Black Americans 1970 County.png 15,610 × 8,900; 11.55 MB
-
 Black Americans 1980 County.png 15,610 × 8,900; 11.66 MB
-
 Black Americans 1990 County.png 15,610 × 8,900; 19.01 MB
-
 Black Americans 2000 County.png 15,610 × 8,900; 11.65 MB
-
 Black Americans 2010 County.png 15,610 × 8,900; 12.05 MB
-
 Black Americans 2020 County.png 15,610 × 8,900; 11.69 MB
-
 Conscientiousness by state.jpg 389 × 314; 16 KB
-
 Conservative Gallup 8-10.svg 512 × 317; 57 KB
-
 Demographic and Socioeconomic Characteristics of Atlanta (5458021392).jpg 3,245 × 2,515; 1.46 MB
-
 Demographic and Socioeconomic Characteristics of Chicago (5458021462).jpg 3,245 × 2,515; 1.18 MB
-
 Demographic and Socioeconomic Characteristics of Denver (5457414833).jpg 3,244 × 2,518; 1.64 MB
-
 Demographic and Socioeconomic Characteristics of Kansas City (5457424151).jpg 3,245 × 2,515; 1.3 MB
-
 Demographic and Socioeconomic Characteristics of Los Angeles (5457414897).jpg 3,245 × 2,515; 1.54 MB
-
 Demographic and Socioeconomic Characteristics of Miami (5457414947).jpg 3,245 × 2,515; 1,022 KB
-
 Demographic and Socioeconomic Characteristics of Minneapolis (5457415015).jpg 3,251 × 2,515; 1.58 MB
-
 Demographic and Socioeconomic Characteristics of New York (5457415101).jpg 3,245 × 2,511; 1.53 MB
-
 Demographic and Socioeconomic Characteristics of New York (5458030892).jpg 3,258 × 2,522; 1.32 MB
-
 Demographic and Socioeconomic Characteristics of Phoenix (5457424245).jpg 3,245 × 2,515; 1.25 MB
-
 Demographic and Socioeconomic Characteristics of Seattle (5458031006).jpg 3,245 × 2,516; 1.33 MB
-

-

-

-
 Extraversion by state1.jpg 389 × 314; 15 KB
-
 Florida ancestry map.gif 968 × 578; 49 KB
-
 Florida Urbanized Areas.jpg 5,950 × 5,950; 2.19 MB
-
 Geographical Distribution Japanese Population USA 1940 1.jpg 4,248 × 2,522; 2 MB
-
 Health uninsurance rates in the United States by state, 2009.svg 572 × 372; 133 KB
-
 Hispanic Americans 1980 County.png 9,470 × 5,635; 6.79 MB
-
 Hispanic Americans 1990 County.png 9,470 × 5,635; 11.76 MB
-
 Hispanic Americans 2000 County.png 9,470 × 5,635; 6.8 MB
-
 Hispanic Americans 2010 County.png 9,470 × 5,635; 11.49 MB
-
 Hispanic Americans 2020 County.png 9,470 × 5,635; 13.36 MB
-
 Homebirth State Data 2009.png 727 × 400; 95 KB
-
 Importance of Religion in the United States of America.svg 959 × 593; 72 KB
-
 Kentucky ancestry map.jpg 2,074 × 632; 402 KB
-
 Liberal Gallup 8-10.svg 959 × 593; 89 KB
-

-
 Massachusetts municipal population flows.svg 1,000 × 619; 2.24 MB
-
 Median Age of the US by County 2010.png 1,631 × 859; 440 KB
-
 Median Household Income by Census Block Group.png 842 × 688; 281 KB
-

-

-
 Median Household Income per County as of 2021.png 6,900 × 4,326; 4.31 MB
-
 Milbystate.png 1,440 × 864; 62 KB
-
 MillionaireHouseholds.png 1,440 × 864; 68 KB
-
 NECTA Divisions.png 1,056 × 816; 68 KB
-
 New 2000 white percent.gif 2,604 × 2,012; 700 KB
-
 Non-Hispanic White Americans 1930 County.png 15,610 × 8,900; 15.94 MB
-
 Non-Hispanic White Americans 1980 County.png 15,610 × 8,900; 16.51 MB
-
 Non-Hispanic White Americans 1990 County.png 15,610 × 8,900; 16.78 MB
-
 Non-Hispanic White Americans 2000 County.png 15,610 × 8,900; 10.88 MB
-
 Non-Hispanic White Americans 2010 County.png 15,610 × 8,900; 11.27 MB
-
 Non-Hispanic White Americans 2020 County.png 15,610 × 8,900; 17.86 MB
-
 Non-Whites (Hispanic and Non-Hispanic) in the US in 2020.svg 1,852 × 971; 4.26 MB
-
 One Person Households (5458009886).jpg 3,258 × 2,542; 2.41 MB
-
 Openness by state thumbnail.jpg 140 × 113; 5 KB
-
 Percent of Births to Unmarried Women in the United States by State.svg 600 × 400; 114 KB
-

-
 Population density of U.S. counties.png 6,518 × 4,061; 3.08 MB
-
 Population density of U.S. states and territories.png 5,285 × 3,762; 1.05 MB
-
 Poverty (5458026498).jpg 2,426 × 3,292; 1.15 MB
-
 Poverty 1990 (7158282686).jpg 2,495 × 3,292; 1.29 MB
-
 PSM V78 D421 Population increase by state as of 1910.png 1,650 × 1,076; 341 KB
-
 PSM V81 D210 Per square mile us population distribution in 1910.png 1,613 × 1,024; 401 KB
-
 PSM V81 D211 Percent increase of us population between 1900 to 1910.png 1,606 × 1,026; 280 KB
-
 Race and Hispanic origin population density of the United States- 1990 LOC 97682420.jpg 6,526 × 5,718; 5.71 MB
-
 Republican v Democrat Gallup 08.svg 959 × 593; 89 KB
-
 Republican v Democrat Gallup 6-10.svg 959 × 593; 89 KB
-

-

-
 Self-identified liberals 2018 Gallup.svg 512 × 317; 57 KB
-
 Slave population.JPG 432 × 346; 45 KB
-
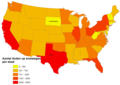
 State gun suicide rate 2021.png 2,550 × 1,800; 404 KB
-
 State homicide rate 2021.png 2,550 × 1,800; 379 KB
-
 State suicide rate 2021.png 2,550 × 1,800; 424 KB
-
 State violent crime rate 2022.png 2,550 × 1,800; 414 KB
-

-
 Summary File 1, 2010 Households Density (35051747671).jpg 3,095 × 2,445; 928 KB
-
 Summary File 1, 2010 Housing Units Density (35051744691).jpg 3,095 × 2,445; 956 KB
-
 Summary File 1, 2010 Occupied Housing Units (%) (35051746771).jpg 3,095 × 2,445; 1.23 MB
-
 Summary File 1, 2010 One-Person Housing Units (%) (35051747271).jpg 3,095 × 2,445; 1.15 MB
-
 Summary File 1, 2010 Owner-Occupied Housing Units (%) (35051746311).jpg 3,095 × 2,445; 1.33 MB
-
 Summary File 1, 2010 Population Age 25 and Older (%) (35051746231).jpg 3,095 × 2,445; 1.36 MB
-
 Summary File 1, 2010 Population Age 25 to 64 (%) (35051749991).jpg 3,095 × 2,445; 1.35 MB
-
 Summary File 1, 2010 Population Age 65 to 79 (%) (35051749791).jpg 3,095 × 2,445; 1.1 MB
-
 Summary File 1, 2010 Population Age 80 and Older (%) (35051752971).jpg 3,095 × 2,445; 939 KB
-
 Summary File 1, 2010 Population Ages 1 to 4 (%) (35051750471).jpg 3,095 × 2,445; 885 KB
-
 Summary File 1, 2010 Population Ages 18 to 24 (%) (35051750231).jpg 3,095 × 2,445; 954 KB
-
 Summary File 1, 2010 Population Ages 5 to 17 (%) (35051750401).jpg 3,095 × 2,445; 1.04 MB
-
 Summary File 1, 2010 Population Density (34337604624).jpg 3,095 × 2,445; 1,002 KB
-
 Summary File 1, 2010 Population in Households (%) (34337603204).jpg 3,095 × 2,445; 1.25 MB
-
 Summary File 1, 2010 Population Under Age 1 (%) (35051748331).jpg 3,095 × 2,445; 838 KB
-
 Summary File 1, 2010 Population Under Age 25 (%) (34337602274).jpg 3,095 × 2,445; 1.23 MB
-
 Summary File 1, 2010 Vacant Housing Units (%) (35051745301).jpg 3,095 × 2,445; 1.11 MB
-
 Summary File 1, 2010 Women of Childbearing Age (%) (35051750781).jpg 3,095 × 2,445; 1.06 MB
-
 The American Museum journal (c1900-(1918)) (18161635395).jpg 1,978 × 2,726; 1.03 MB
-
 The upward path - the evolution of a race (1909) (14583988820).jpg 2,656 × 1,822; 1.72 MB
-
 Total Fertility Rate by U.S. state.svg 1,199 × 593; 73 KB
-
 Towns income per capita in MA.jpg 788 × 466; 104 KB
-
 U.S. Census Bureau Regions.svg 548 × 380; 320 KB
-
 United States Map of Adult Smoking Prevalence by State (2015).svg 850 × 499; 516 KB
-
 United States Map of Obesity Prevalence by State (2013).svg 850 × 499; 516 KB
-
 United States Map of Percent Uninsured by State (2014).svg 850 × 499; 516 KB
-

-
 US foreign-born 2016.png 1,425 × 625; 39 KB
-
 US immigration DV.png 1,425 × 625; 40 KB
-
 US immigration FE.png 1,425 × 625; 39 KB
-
 US Map States same-sex r.jpg 600 × 382; 73 KB
-
 US Mean Center of Population 1790-2010.PNG 1,084 × 757; 151 KB
-
 US Mean Center of Population 1790-2020.png 2,200 × 1,700; 1.17 MB
-
 US Mean Center of Population 1790-2020.svg 1,056 × 816; 4.11 MB
-
 US States by birth rate (2015).svg 959 × 593; 32 KB
-
 US States by death rate (2015).svg 959 × 593; 32 KB
-
 US states by percent union members (2017).svg 959 × 593; 32 KB
-
 US teen birth rate by state.svg 600 × 400; 115 KB
-
 US White Alone in 2020.svg 1,200 × 650; 1.51 MB
-
 USA - percent over 65 - 2000.png 858 × 467; 60 KB
-
 USA 2000 white density.gif 914 × 650; 56 KB
-
 USA population distribution 1790.png 931 × 1,638; 344 KB
-
 USA population distribution 1800.png 925 × 1,636; 353 KB
-
 USA population distribution 1820.png 940 × 1,625; 371 KB
-
 USA stroke belt.png 556 × 354; 52 KB
-
 UScenter2020.png 1,280 × 989; 582 KB
-
 USCenterPop Geographic2010.png 2,833 × 1,977; 180 KB
-
 USCenterPop Median2010.png 3,300 × 2,550; 227 KB
-
 USurban1820.png 506 × 313; 6 KB
-
 USurban1870.png 506 × 313; 6 KB
-
 USurban1940.png 506 × 313; 7 KB
-
 USurban2010.png 506 × 313; 6 KB
-
 Vs choropleet fout.PNG 1,589 × 1,083; 98 KB
-
 VS choropleet.PNG 1,582 × 995; 92 KB
-
 Vs figuratief snelwegdoden per staat.PNG 1,561 × 935; 139 KB
-
 Vs figuratief.PNG 1,583 × 1,052; 92 KB
-
 VS inwoners pmi2 met foute visuele rangorde kleur.PNG 1,022 × 652; 43 KB
-
 VS inwoners pmi2 met foute visuele rangorde zw w.PNG 1,022 × 652; 48 KB
-
 VS inwoners pmi2 met juiste visuele rangorde zw w choropleet.PNG 1,582 × 995; 91 KB
-
 Vs kartogram.PNG 1,587 × 1,086; 103 KB
-
 Vs snelweg doden per staat.png 3,392 × 2,400; 326 KB
-
 Vs snelweg doden.png 3,366 × 2,111; 441 KB
-
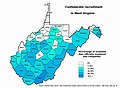 Confederate recruitment in West Virginia.jpg 6,915 × 5,064; 4.17 MB
-
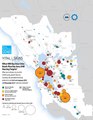 What year will San Francisco Bay Area cities reach their Plan2040 housing targets.pdf 1,645 × 2,131; 661 KB
-
 White Americans 1790 County.png 10,218 × 8,273; 3.04 MB
-
 White Americans 1800 County.png 10,218 × 8,500; 3.57 MB
-
 White Americans 1810 County.png 14,950 × 8,865; 7.33 MB
-
 White Americans 1820 County.png 14,818 × 9,000; 8.39 MB
-
 White Americans 1830 County.png 13,100 × 8,800; 4.91 MB
-
 White Americans 1840 County.png 13,210 × 8,900; 5.42 MB
-
 White Americans 1850 County.png 15,610 × 8,900; 6.66 MB
-
 White Americans 1860 County.png 15,610 × 8,900; 7.63 MB
-
 White Americans 1870 County.png 15,610 × 8,900; 8.11 MB
-
 White Americans 1880 County.png 15,610 × 8,900; 9.69 MB
-
 White Americans 1890 County.png 15,610 × 8,900; 9.94 MB
-
 White Americans 1900 County.png 15,610 × 8,900; 10.18 MB
-
 White Americans 1910 County.png 15,610 × 8,900; 9.6 MB
-
 White Americans 1920 County.png 15,610 × 8,900; 15.77 MB
-
 White Americans 1940 County.png 15,610 × 8,900; 10.45 MB
-
 White Americans 1950 County.png 15,610 × 8,900; 9.86 MB
-
 White Americans 1960 County.png 15,610 × 8,900; 10.66 MB


,_1880.jpg)


.svg)


.jpg)
.jpg)
.jpg)
.jpg)
.jpg)
.jpg)
.jpg)
.jpg)
.jpg)
.jpg)
.jpg)


.jpg)


_in_the_US_in_2020.svg)
.jpg)


.svg)


.jpg)
.jpg)


_(14577661840).jpg)
_(14764353845).jpg)


_(35051748031).jpg)
.jpg)
.jpg)
_(35051746771).jpg)
_(35051747271).jpg)
_(35051746311).jpg)
_(35051746231).jpg)
_(35051749991).jpg)
_(35051749791).jpg)
_(35051752971).jpg)
_(35051750471).jpg)
_(35051750231).jpg)
_(35051750401).jpg)
.jpg)
_(34337603204).jpg)
_(35051748331).jpg)
_(34337602274).jpg)
_(35051745301).jpg)
_(35051750781).jpg)
)_(18161635395).jpg)
_(14583988820).jpg)


.svg)
.svg)
.svg)
_per_1,000_People_by_State_(2014).svg)


.svg)
.svg)
.svg)


