Category:Economic maps of the United States
Jump to navigation
Jump to search
Subcategories
This category has the following 19 subcategories, out of 19 total.
A
B
E
F
G
- GDP maps of the United States (11 F)
H
- HDI maps of the United States (10 F)
I
L
M
P
T
- Tax maps of the United States (11 F)
Media in category "Economic maps of the United States"
The following 109 files are in this category, out of 109 total.
-
-
 % of Total Houses by US county, Built By Time Period, US Census.gif 1,554 × 902; 1.77 MB
-
 1991077 900 019ac (20148362186).jpg 4,145 × 2,789; 595 KB
-
 1991077 900 020ac (19986613030).jpg 4,223 × 2,866; 676 KB
-
 2006American exports.PNG 1,425 × 625; 60 KB
-
 2019 AATCC Updated Section MAP 053019.png 5,175 × 3,762; 1.42 MB
-
 Albertsonslocationsmap.PNG 1,513 × 983; 62 KB
-

-
 Arag-international-map.jpg 549 × 647; 74 KB
-
 Automobile assembly plants in the USA in 2004.png 950 × 576; 76 KB
-
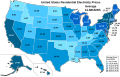
 Average Residential Price of Electricity by State.svg 990 × 627; 304 KB
-
 Average Retail Price of Electricity by State.jpg 1,513 × 983; 313 KB
-
 Average US Residential Price of Electricity by State fr.svg 990 × 627; 305 KB
-
 Average US Residential Price of Electricity by State-2012.svg 990 × 627; 298 KB
-
 Baby Bells.png 904 × 593; 54 KB
-
 Baby Bells.svg 959 × 593; 26 KB
-
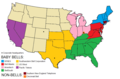
 BEA regions.png 747 × 508; 97 KB
-
 Bell telephone magazine (1922) (14568704477).jpg 2,020 × 2,302; 797 KB
-
 Bell telephone magazine (1922) (14569702640).jpg 2,816 × 1,712; 749 KB
-
 Bell telephone magazine (1922) (14569705110).jpg 1,566 × 854; 213 KB
-
 Bell telephone magazine (1922) (14569705540).jpg 2,816 × 1,892; 690 KB
-
 Bell telephone magazine (1922) (14569706080).jpg 1,184 × 2,048; 274 KB
-
 Bell telephone magazine (1922) (14569933547).jpg 2,736 × 2,058; 1.17 MB
-
 Bell telephone magazine (1922) (14569944817).jpg 1,692 × 1,134; 306 KB
-
 Bell telephone magazine (1922) (14753218791).jpg 1,718 × 1,146; 248 KB
-
 Bell telephone magazine (1922) (14754064754).jpg 2,318 × 1,464; 879 KB
-
 Bell telephone magazine (1922) (14756059322).jpg 2,512 × 1,494; 1.23 MB
-
 Bell telephone magazine (1922) (14776252463).jpg 2,640 × 1,554; 695 KB
-
 Bigrivercablecoveragearea.png 412 × 206; 9 KB
-
 Cable partner map 4-2-09.JPG 774 × 526; 171 KB
-
 Carte charbon USA 2006.png 2,500 × 2,116; 866 KB
-
 Carte gaz USA 2006.png 2,500 × 2,116; 875 KB
-
 Carte gaz USA 2006.svg 957 × 810; 343 KB
-
 Carte minerais USA 2007.png 2,500 × 2,116; 848 KB
-
 Carte minerais USA 2007.svg 957 × 810; 343 KB
-
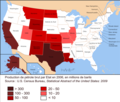 Carte pétrole USA 2006.png 2,500 × 2,116; 850 KB
-
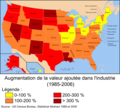 Carte valeur industrie 1985-2006.png 1,106 × 1,008; 316 KB
-
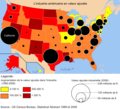 Carte valeur industrie 2006.png 1,987 × 1,810; 546 KB
-
 Cb13-33 figure4.tif 404 × 295; 181 KB
-
 Central Office Locations.png 1,056 × 816; 99 KB
-
 Centurylink DSL ISP Coverage Map.png 684 × 376; 83 KB
-
 CenturyLink network map.jpg 2,873 × 1,577; 824 KB
-
 Clason's industrial map of Colorado. - DPLA - 3f383570e95ce903ee5716228257a62d.jpg 9,000 × 7,552; 14.84 MB
-
 Comparison between U.S. states and countries by GDP in 2012.jpg 1,513 × 983; 240 KB
-
 Container-deposit legislation in US and Canadian states.svg 512 × 512; 117 KB
-
 Cooperative economic insect report (1968) (20669949236).jpg 3,308 × 1,880; 934 KB
-
 Craft Breweries Per Capita (US).png 1,100 × 680; 121 KB
-
 Craft Breweries Per Capita (US).svg 959 × 593; 107 KB
-
 Data on food deserts.png 1,034 × 556; 795 KB
-
 Detasseling Map.png 1,256 × 1,011; 167 KB
-
 Distribution of Farming, Lumbering, and Mining Industries in Washington, 1914.jpg 1,777 × 1,187; 1.05 MB
-
 DuMont Affiliates 1949.png 882 × 574; 48 KB
-
 Family Promise Affiliate Map.jpg 3,400 × 2,200; 677 KB
-
 FederalNetperCapita2014.png 677 × 514; 52 KB
-
 Figure05-teachers wages.png 560 × 510; 60 KB
-
 Google Fiber Map.jpeg 1,920 × 1,080; 378 KB
-
 Harristeeterstates.PNG 841 × 580; 27 KB
-
 Highmhhimap.png 300 × 221; 74 KB
-
 Highpcimap.png 300 × 221; 74 KB
-
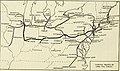
 Highways USA 1825.png 938 × 762; 188 KB
-
 LgTelephoneMap.jpg 22,829 × 15,502; 99.54 MB
-
 Love'sTravelStopMap.JPG 640 × 480; 53 KB
-
 Lowmhhimap.svg 986 × 624; 1.26 MB
-
 Lowpcimap.png 300 × 221; 75 KB
-
 Lowpcimap.svg 986 × 624; 1.26 MB
-
 Map of housing conditions, Seattle, 1960 (49465003892).jpg 1,287 × 1,971; 228 KB
-
 Map of mafia in the us.png 5,285 × 3,762; 1.28 MB
-
 Map of stores owned by Albertson's in the United States.png 2,560 × 1,583; 347 KB
-
 Map of USA highlighting states with no income tax on wages.svg 959 × 593; 78 KB
-
 Map of USA highlighting states with no income tax.svg 959 × 593; 78 KB
-
 Map of WW2 Shipyards building DD.jpg 853 × 630; 94 KB
-
 MapSEPT2011.jpg 1,656 × 1,740; 2.53 MB
-
 Market.svg 960 × 500; 349 KB
-
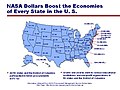 NASA dollars.jpg 720 × 540; 74 KB
-
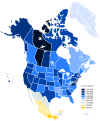 North America first level political divisions by income.svg 1,789 × 2,154; 537 KB
-
 NUCA Map w logo 11-19.png 1,500 × 1,130; 358 KB
-
 NUCA map.png 1,000 × 667; 122 KB
-

-
 Overfished US stocks 2010.png 1,016 × 701; 287 KB
-
 Paid sick leave laws in the United States.svg 959 × 593; 58 KB
-
 Pathways Out of Poverty Locations.jpg 1,053 × 814; 60 KB
-
 Per capita personal income change in metropolitan counties, 1980-2002.png 1,220 × 861; 171 KB
-

-
 Poverty by U.S. state.svg 1,199 × 593; 71 KB
-
 Rust and Sun Belts.png 800 × 500; 98 KB
-
 Rust-belt-map.jpg 280 × 183; 19 KB
-
 Smile FM stations.png 1,568 × 1,808; 262 KB
-
 Spoke Hub Distribution.svg 512 × 292; 125 KB
-
 Stroke belt.svg 959 × 593; 90 KB
-
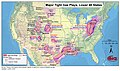 Tight natural gas plays in the lower 48 states of the USA.jpg 2,200 × 1,300; 1.71 MB
-
 Total mfctrg jobs change 54-02.png 1,236 × 857; 158 KB
-
 U.S. GDP by state 2008 (current dollars).jpg 590 × 530; 139 KB
-
 U.S. states by GDP per capita, 2017.jpg 5,175 × 2,872; 1.86 MB
-
 U.S.A. states by GDP per capita in 2015.jpg 5,400 × 3,585; 1.23 MB
-
 United States by Gini Coefficient.png 935 × 722; 193 KB
-
 United States Slavery Map 1860-sw.jpg 1,200 × 672; 167 KB
-
 United States uranium resources map LOC 79692715.jpg 23,526 × 14,722; 24.24 MB
-
 Urbansim-map.png 280 × 360; 222 KB
-
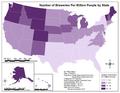 US Breweries Per One Million People By State 2012.pdf 1,650 × 1,275; 377 KB
-
 US GDP per capita by state 2010 (current dollars).svg 512 × 240; 64 KB
-
 US State Credit Ratings Fitch January 2017.svg 959 × 593; 32 KB
-
 US State Credit Ratings Moodys January 2017.svg 959 × 593; 32 KB
-
 US State Credit Ratings S&P January 2017.svg 959 × 593; 32 KB
-
 US states by GDP per capita (nominal).PNG 945 × 583; 25 KB
-
 US states by percent union members (2017).svg 959 × 593; 32 KB
-
 USA 2008 workforce exponent by county.svg 555 × 352; 1.37 MB
-
 USA home appreciation 1998 2006.svg 959 × 593; 332 KB
-
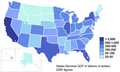 USA states nominal gdp 2005.PNG 960 × 580; 34 KB
-
 USA states nominal gdp.PNG 960 × 580; 36 KB


.jpg)
.jpg)


_(19366177585).jpg)


_(14568704477).jpg)
_(14569702640).jpg)
_(14569705110).jpg)
_(14569705540).jpg)
_(14569706080).jpg)
_(14569933547).jpg)
_(14569944817).jpg)
_(14753218791).jpg)
_(14754064754).jpg)
_(14756059322).jpg)
_(14776252463).jpg)


_(20669949236).jpg)
.png)
.svg)


.jpg)


.jpg)


.png)


.jpg)


.svg)


.PNG)
.svg)


