Category:Our World in Data
Jump to navigation
Jump to search
website that presents data and statistics of socially relevant topics | |||||
| Upload media | |||||
| Instance of |
| ||||
|---|---|---|---|---|---|
| Location | University of Oxford, Oxfordshire, South East England, England | ||||
| Language of work or name | |||||
| Founded by |
| ||||
| Inception |
| ||||
| official website | |||||
| |||||
English: Online publication Our World In Data, that presents empirical research and data that show how living conditions around the world are changing.
Português: Publicação digital Our World In Data, publicação digital especializada em expor pesquisas empíricas e dados analíticos sobre mudanças nas condições de qualidade de vida ao redor do mundo.
Italiano: Pubblicazione su InternetOur World In Data, che presenta ricerca empirica e dati che mostrano come stanno cambiando le condizioni di vita nel mondo.
Español: Publicación en-línea Our World In Data, que presenta datos y resultados empíricos que muestran el cambio en las condiciones de vida en todo mundo.

Subcategories
This category has the following 13 subcategories, out of 13 total.
D
- Our World in Data datasets (516 P)
E
F
H
- Our World in Data - Health (762 F)
O
- Our World in Data - Other (59 F)
- OWID Gadget (3 F)
P
W
Pages in category "Our World in Data"
This category contains only the following page.
Media in category "Our World in Data"
The following 200 files are in this category, out of 2,000 total.
(previous page) (next page)-
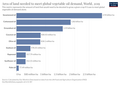
 Access to a financial account or services, OWID.svg 850 × 600; 58 KB
-

-

-

-
 Adjusted net saving (current US dollars), OWID.svg 850 × 600; 20 KB
-
 Adjusted net savings per capita, OWID.svg 850 × 600; 19 KB
-
 Age of democracies at the end of 2015, OWID.svg 850 × 600; 142 KB
-
 Age of democracies at the end of 2015.svg 850 × 600; 155 KB
-
 Aid received per capita vs. GDP per capita, OWID.svg 850 × 600; 27 KB
-
 Aid received per capita, OWID.svg 850 × 600; 140 KB
-
 Ambient-pollution-death-rates-2017-1990 (OWID 0072).png 850 × 600; 97 KB
-
-
 Annual food expenditure per person vs. GDP per capita, OWID.svg 850 × 600; 20 KB
-
 Annual healthcare expenditure per capita, OWID.svg 850 × 600; 140 KB
-
 Annual hours worked per worker, OWID.svg 850 × 600; 23 KB
-
 Annual number of deaths by age group in England and Wales, OWID.svg 850 × 600; 26 KB
-

-

-

-

-
 Are married women required by law to obey their husbands., OWID.svg 850 × 600; 139 KB
-
-

-

-
 Area-land-needed-to-global-oil (OWID 0089).png 850 × 600; 65 KB
-
 Armed forces personnel as share of total population, OWID.svg 850 × 600; 16 KB
-
 Armed forces personnel, OWID.svg 850 × 600; 17 KB
-
 Automated teller machines (ATMs), OWID.svg 850 × 600; 140 KB
-
 Average acres burned per wildfire in the United States, OWID.svg 850 × 600; 9 KB
-
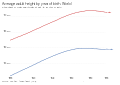 Average adult height by year of birth, OWID.svg 850 × 600; 14 KB
-
 Average annual precipitation by region, OWID.svg 850 × 600; 7 KB
-
 Average annual working hours vs. GDP per capita, OWID.svg 850 × 600; 17 KB
-
 Average corn yields in the United States, 1866-2014, OWID.svg 850 × 600; 12 KB
-
 Average daily hours of work in summer, by industry, OWID.svg 850 × 600; 12 KB
-
 Average daily hours of work in winter, by industry, OWID.svg 850 × 600; 9 KB
-
 Average daily hours of work, by occupation, United States, OWID.svg 850 × 600; 10 KB
-
 Average daily hours worked, by industry, United States, OWID.svg 850 × 600; 10 KB
-

-
 Average daily work hours, by industry, OWID.svg 850 × 600; 9 KB
-
-
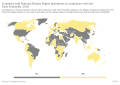
 Average-price-of-a-pack-of-cigarettes 2012.png 3,101 × 1,824; 491 KB
-

-
 Biomass-vs-abundance-taxa (OWID 0137).png 850 × 600; 65 KB
-
 Bird-populations-eu (OWID 0139).png 850 × 600; 55 KB
-
 Black rhino population, OWID.svg 850 × 600; 5 KB
-
 Borrowing to start or expand business, men vs women, OWID.svg 850 × 600; 33 KB
-
 Bp-country-coverage (OWID 0136).png 850 × 600; 87 KB
-
-
 Breakdown of child mortality by cause, OWID.svg 850 × 600; 9 KB
-
 Breakdown of United Nations peacekeeping forces, OWID.svg 850 × 600; 7 KB
-
 Broadband subscriptions per 100 people, OWID.svg 850 × 600; 11 KB
-
 Budget-to-manage-invasive-alien-species (OWID 0135).png 850 × 600; 101 KB
-
 Capital intensity vs. labor productivity, OWID.svg 850 × 600; 59 KB
-
 Capital intensity, OWID.svg 850 × 600; 18 KB
-
 Capture-fisheries-vs-aquaculture (OWID 0131).png 850 × 600; 67 KB
-
 Catch-fishing-power-uk (OWID 0117).png 850 × 600; 75 KB
-
 Change in average fullscale IQ by country, OWID.svg 850 × 600; 6 KB
-
 Change-energy-consumption (OWID 0163).png 850 × 600; 60 KB
-
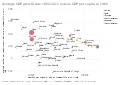
 Change-energy-gdp-per-capita (OWID 0164).png 850 × 600; 81 KB
-
 Change-global-hunger-index-pop-growth (OWID 0160).png 850 × 600; 103 KB
-
 Change-population-gdp-meat (OWID 0153).png 850 × 600; 54 KB
-
 Child death rates by cause for boys vs. girls in India, OWID.svg 850 × 600; 11 KB
-
 Child deaths by life stage, OWID.svg 850 × 600; 8 KB
-
 Child deaths in 1960 vs. 2017, OWID.svg 850 × 600; 20 KB
-
 Child homicide rate, OWID.svg 850 × 600; 142 KB
-
 Childhood-deaths-from-the-five-most-lethal-infectious-diseases-worldwide.png 3,400 × 2,400; 430 KB
-
 Children aged-5-17 engaged in labour.png 3,400 × 2,400; 872 KB
-
 Children in employment vs hours worked by children, OWID.svg 850 × 600; 17 KB
-

-

-
 Children who experience violent discipline, boys vs girls, OWID.svg 850 × 600; 17 KB
-
 Chinese-plastic-imports (OWID 0150).png 850 × 600; 54 KB
-
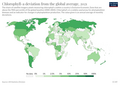 Chlorophyll-a-deviation-from-the-global-average (OWID 0149).png 850 × 600; 114 KB
-
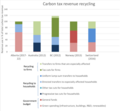 Climate-tax-revenue.png 854 × 789; 99 KB
-
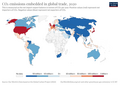 Co-emissions-embedded-in-global-trade (OWID 0146).png 850 × 600; 109 KB
-
 Coal-vs-gdp-per-capita (OWID 0256).png 850 × 600; 91 KB
-
 Coefficient of Variation (CV) in per capita caloric intake, OWID.svg 850 × 600; 143 KB
-

-
 Comparing-the-share-of-men-and-women-who-are-smoking.png 3,302 × 1,873; 483 KB
-

-

-
 Composition of national gross domestic product by sector, OWID.svg 850 × 600; 16 KB
-
 Composition of tax revenues, OWID.svg 850 × 600; 7 KB
-
 Compulsory voting in national elections.svg 850 × 600; 167 KB
-

-

-

-
 Consumption shares in non-essential products, OWID.svg 850 × 600; 8 KB
-
 Consumption shares in selected non-essential products, OWID.svg 850 × 600; 4 KB
-
 Consumption-per-smoker-per-day.png 3,087 × 1,878; 503 KB
-
 Contraceptive prevalence, any methods (% of women ages 15-49), OWID.svg 850 × 600; 141 KB
-
 Contraceptive prevalence- any methods vs modern methods, OWID.svg 850 × 600; 28 KB
-
 Coronavirus-cfr more Countries.svg 850 × 600; 33 KB
-

-

-
-
-
 Corruption Perception Index, OWID.svg 850 × 600; 142 KB
-
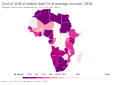 Cost of 1GB of mobile data (% of average income), OWID.svg 850 × 600; 139 KB
-

-
-
 Countries subscribed to the Montreal Protocol, OWID.svg 850 × 600; 139 KB
-
-
 Countries that are parties to the Nagoya Protocol, OWID.svg 850 × 600; 138 KB
-
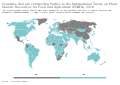
 Countries that have ever elected a woman to parliament, OWID.svg 850 × 600; 138 KB
-
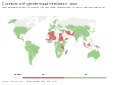 Countries with gender-equal inheritance, OWID.svg 850 × 600; 138 KB
-
-

-

-
 Countries-with-independent-national-human-rights-institution.png 3,400 × 2,400; 823 KB
-
 Countries-with-legislative-regulatory-provisions-for-managing-disaster-risk.png 3,400 × 2,400; 838 KB
-

-
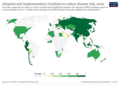
 Countries-with-national-adaptation-plans-for-climate-change.png 3,400 × 2,400; 359 KB
-
 Countries-with-stats-plan-funded-by-source.png 3,400 × 2,400; 354 KB
-
 Country Programmable Aid (CPA) received, OWID.svg 850 × 600; 140 KB
-

-
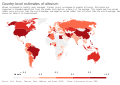 Country-level estimates of altruism, OWID.svg 850 × 600; 140 KB
-
 Country-level estimates of negative reciprocity, OWID.svg 850 × 600; 140 KB
-
 Country-level estimates of patience, OWID.svg 850 × 600; 140 KB
-
 Country-level estimates of positive reciprocity, OWID.svg 850 × 600; 140 KB
-
 Country-level estimates of risk taking, OWID.svg 850 × 600; 140 KB
-
 Country-level estimates of trust, OWID.svg 850 × 600; 139 KB
-
 Country-scp-plan.png 3,400 × 2,400; 833 KB
-
 Covax-donations-per-capita.png 3,400 × 2,400; 453 KB
-

-

-
 Coverage of social insurance programs (% of population), OWID.svg 850 × 600; 140 KB
-
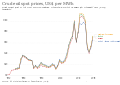
 Crude oil prices, OWID.svg 850 × 600; 12 KB
-
 Crude oil production in the United Kingdom, 1920-2016, OWID.svg 850 × 600; 9 KB
-
 Crude oil spot prices, US$ per MWh, OWID.svg 850 × 600; 14 KB
-
 Crude-oil-spot-prices (OWID 0226).png 850 × 600; 78 KB
-
 Cumulative CO₂ emissions by world region, OWID-da.svg 850 × 600; 86 KB
-
 Cumulative CO₂ emissions by world region, OWID.svg 850 × 600; 86 KB
-
 Cyclone-power-dissipation-index (OWID 0213).png 850 × 600; 63 KB
-
 Deaths from drowning, by age, OWID.svg 850 × 600; 11 KB
-
 Deaths from fire, by age, OWID.svg 850 × 600; 11 KB
-
 Deaths from homicide, by age, OWID.svg 850 × 600; 11 KB
-
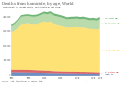
 Deaths from mental health and substance use disorders, OWID.svg 850 × 600; 141 KB
-
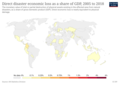
 Deaths from natural disasters as a share of total deaths, OWID.svg 850 × 600; 140 KB
-
 Deaths from road incidents, by age, OWID.svg 850 × 600; 11 KB
-
 Deaths from suicide, by age, OWID.svg 850 × 600; 9 KB
-
 Deaths from tobacco, alcohol and drugs, OWID.svg 850 × 600; 7 KB
-
 Deaths-air-pollution-vs-gdp (OWID 0307).png 850 × 600; 115 KB
-
 Deaths-and-missing-persons-due-to-natural-disasters (OWID 0306).png 850 × 600; 98 KB
-

-
 Deaths-from-air-pollution (OWID 0303).png 850 × 600; 48 KB
-
 Deaths-from-indoor-air-pollution-by-age (OWID 0298).png 850 × 600; 52 KB
-
 Deaths-from-natural-disasters (OWID 0301).png 850 × 600; 93 KB
-
 Deaths-from-natural-disasters-by-type (OWID 0299).png 850 × 600; 64 KB
-
 Deaths-from-ozone-pollution (OWID 0300).png 850 × 600; 97 KB
-
 Deaths-from-particulate-matter-pollution (OWID 0297).png 850 × 600; 100 KB
-
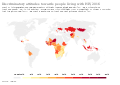
 Deaths-lead-exposure.png 3,400 × 2,400; 733 KB
-
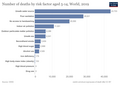
 Deaths-risk-factor-15-49years.png 3,400 × 2,400; 531 KB
-
 Deaths-risk-factor-5-14years.png 3,400 × 2,400; 398 KB
-
 Debt Service of Exports of Goods and Services.png 3,400 × 2,400; 819 KB
-
 Debt-service-of-exports-of-goods-services.png 3,400 × 2,400; 798 KB
-
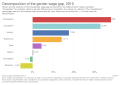
 Decomposition of the gender wage gap, 1, OWID.svg 850 × 600; 8 KB
-
 Decomposition of the gender wage gap, OWID.svg 850 × 600; 8 KB
-
 Decomposition rates of marine debris items, OWID.svg 850 × 600; 8 KB
-
-
 Demand for family planning satisfied by modern methods, OWID.svg 850 × 600; 141 KB
-
 Demographic-Transition-5-countries.png 2,999 × 2,025; 413 KB
-
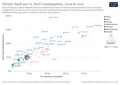
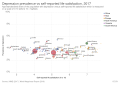 Depression prevalence vs self-reported life satisfaction, OWID.svg 850 × 600; 31 KB
-
 Depressive disorder DALYs, age-standardized rate, OWID.svg 850 × 600; 141 KB
-
 Depth of the food deficit in kilocalories per person per day, OWID.svg 850 × 600; 144 KB
-
 Development assistance allocated to health causes, OWID.svg 850 × 600; 21 KB
-
 Development assistance as share of government expense, OWID.svg 850 × 600; 140 KB
-
 Development-assistance-for-infrastructure.png 3,400 × 2,400; 691 KB
-
 Diamond production, OWID.svg 850 × 600; 139 KB
-
 Dietary composition by country, OWID.svg 850 × 600; 53 KB
-
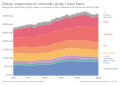 Dietary compositions by commodity group, OWID.svg 850 × 600; 28 KB
-
 Dietary land use vs. GDP per capita, OWID.svg 850 × 600; 34 KB
-
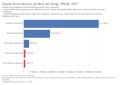
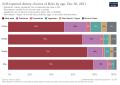
 Dietary-choices-of-british-adults (OWID 0291).png 850 × 600; 75 KB
-
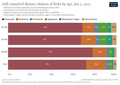
 Dietary-choices-of-british-adults.svg 850 × 600; 32 KB
-
 Dietary-choices-uk (OWID 0292).png 850 × 600; 68 KB
-
 Dietary-land-use-vs-beef-consumption (OWID 0288).png 850 × 600; 98 KB
-
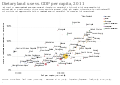
 Dietary-land-use-vs-gdp-per-capita (OWID 0286).png 850 × 600; 113 KB
-

-

-
 Diphtheria vaccine coverage vs Diphtheria cases, OWID.svg 850 × 600; 15 KB
-
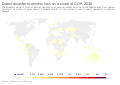 Direct disaster economic loss as a share of GDP, OWID.svg 850 × 600; 141 KB
-
 Direct disaster economic loss, OWID.svg 850 × 600; 140 KB
-
 Direct Disaster Loss as a Share of GDP.png 3,400 × 2,400; 736 KB
-
 Direct economic loss attributed to disasters, OWID.svg 850 × 600; 140 KB
-
 Direct-disaster-loss-as-a-share-of-gdp.png 3,400 × 2,400; 819 KB
-
 Direct-economic-loss-attributed-to-disasters (1).png 3,400 × 2,400; 477 KB
-
 Direct-economic-loss-attributed-to-disasters.png 3,400 × 2,400; 416 KB
-
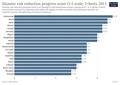
 Disaster risk reduction progress score (1-5 scale; 5=best), OWID.svg 850 × 600; 140 KB
-
 Disaster-risk-reduction-progress (OWID 0282).png 850 × 600; 107 KB
-
 Disaster-risk-reduction-progress.png 3,400 × 2,400; 483 KB
-
 Discrimination towards those with HIV by demographic, OWID.svg 850 × 600; 7 KB
-
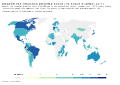
 Discriminatory attitudes towards people living with HIV, OWID.svg 850 × 600; 141 KB
-

-

-
 Disease-burden-vs-health-expenditure-per-capita (1).png 3,400 × 2,400; 635 KB
-

-

-

-

-
 Distribution of Mammals on Earth.png 6,450 × 7,533; 1,006 KB

,_OWID.svg)
,_OWID.svg)
,_OWID.svg)
,_OWID.svg)


.png)


_vs._R%26D_expenditure_(%25_of_GDP),_OWID.svg)


.png)


,_OWID.svg)


,_OWID.svg)


.png)
.png)


.png)
.svg)


.png)


.png)
.png)

.png)
.png)
.png)
.png)


.png)
.png)

.png)
.png)
_in_per_capita_caloric_intake,_OWID.svg)


,_OWID.svg)
),_OWID.svg)


,_OWID.svg)


_and_GDP_per_capita,_OWID.svg)


,_OWID.svg)
.png)
.png)

,_OWID.svg)


.png)


.png)


_received,_OWID.svg)


,_OWID.svg)


.png)


.png)


.png)
.png)
.png)
.png)
.png)
.png)
.png)
.png)
.png)


.png)

.png)
.png)
.png)


.png)

,_OWID.svg)
.png)


.png)


.png)
_for_preventing_mother-to-child_transmission_(MTCT),_OWID.svg)