Category:Our World in Data - Energy and Environment
Jump to navigation
Jump to search
Media in category "Our World in Data - Energy and Environment"
The following 200 files are in this category, out of 690 total.
(previous page) (next page)-
 1970- Decline in species populations - Living Planet Index.svg 1,200 × 675; 6 KB
-

-
 3-Learning-curves-for-electricity-prices.png 2,879 × 2,478; 110 KB
-
 5-Bar-chart-–-What-is-the-safest-form-of-energy.png 1,350 × 727; 358 KB
-
 7 world series from our world in data.png 1,116 × 1,115; 81 KB
-
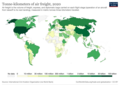
 Above-ground biomass in forest per hectare, OWID.svg 850 × 600; 140 KB
-
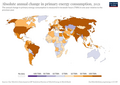 Abs-change-energy-consumption (OWID 0007).png 850 × 600; 107 KB
-

-
 Absolute-change-co2 (OWID 0005).png 850 × 600; 102 KB
-
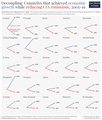 Absolute-decoupling-Growth-and-falling-emissions-all.png 2,175 × 2,565; 313 KB
-
 Access to clean fuels and technologies for cooking, OWID.svg 850 × 600; 141 KB
-
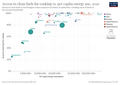
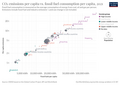
 Access to clean fuels for cooking vs. GDP per capita, OWID.svg 850 × 600; 42 KB
-
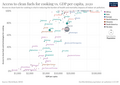
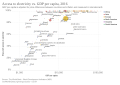 Access to electricity vs. GDP per capita, OWID.svg 850 × 600; 44 KB
-
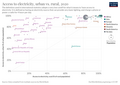
 Access to electricity, urban vs. rural, OWID.svg 850 × 600; 45 KB
-
-
 Access-to-clean-fuels-and-technologies-for-cooking.png 3,400 × 2,400; 806 KB
-
 Access-to-clean-fuels-for-cooking-vs-gdp-per-capita (OWID 0010).png 850 × 600; 98 KB
-
-
 Access-to-electricity-urban-vs-rural (OWID 0011).png 850 × 600; 96 KB
-
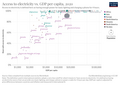 Access-to-electricity-vs-gdp-per-capita (OWID 0041).png 850 × 600; 105 KB
-
 Accumulated Cyclone Energy of North Atlantic hurricanes, OWID.svg 746 × 531; 46 KB
-
 Ace-north-atlantic-hurricanes (OWID 0040).png 850 × 600; 73 KB
-
 Acres-burned-per-wildfire-usa (OWID 0038).png 850 × 600; 52 KB
-
 Acres-burned-usa (OWID 0039).png 850 × 600; 52 KB
-
 African elephant carcass ratio, OWID.svg 850 × 600; 11 KB
-
 African-elephants (OWID 0035).png 850 × 600; 47 KB
-
 Air pollutant emissions, OWID.svg 850 × 600; 13 KB
-
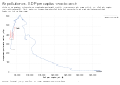 Air pollution vs. GDP per capita, OWID.svg 850 × 600; 11 KB
-
 Air pollution, London vs. Delhi, OWID.svg 850 × 600; 21 KB
-

-
 Air-pollution-deaths-by-age (OWID 0074).png 850 × 600; 59 KB
-
 Air-pollution-deaths-country (OWID 0012).png 850 × 600; 101 KB
-
 Air-pollution-london (OWID 0075).png 850 × 600; 55 KB
-
 Air-pollution-london-vs-delhi (OWID 0076).png 850 × 600; 50 KB
-
 Air-pollution-vs-gdp-per-capita (OWID 0073).png 850 × 600; 72 KB
-
 Air-transport-freight-ton-km.png 3,400 × 2,400; 820 KB
-
 Annual change in atmospheric CFC-11 concentrations, OWID.svg 850 × 600; 6 KB
-
 Annual CO₂ emissions in 2016 vs. 1990, OWID.svg 850 × 600; 41 KB
-
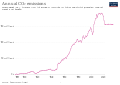
 Annual CO₂ emissions, OWID.svg 850 × 600; 141 KB
-
 Annual freshwater withdrawals, OWID.svg 850 × 600; 141 KB
-
 Annual greenhouse gas emissions, OWID.svg 850 × 600; 140 KB
-
 Annual Heat Wave Index in the United States, OWID.svg 850 × 600; 10 KB
-
 Annual share of global CO₂ emissions, OWID.svg 850 × 600; 141 KB
-
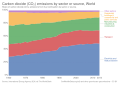
 Annual total CO₂ emissions, by world region, OWID.svg 850 × 600; 108 KB
-
 Annual total CO₂ emissions, by world region.png 3,400 × 2,400; 531 KB
-
 Annual-afforestation (OWID 0067).png 850 × 600; 112 KB
-
 Annual-change-coal (OWID 0066).png 850 × 600; 49 KB
-
 Annual-change-forest-area.svg 850 × 600; 168 KB
-
 Annual-change-fossil-fuels (OWID 0062).png 850 × 600; 107 KB
-
 Annual-change-gas (OWID 0065).png 850 × 600; 102 KB
-
 Annual-change-hydro (OWID 0063).png 850 × 600; 102 KB
-
 Annual-change-low-carbon-energy (OWID 0061).png 850 × 600; 108 KB
-
 Annual-change-nuclear (OWID 0059).png 850 × 600; 99 KB
-
 Annual-change-oil (OWID 0058).png 850 × 600; 99 KB
-
 Annual-change-primary-energy-source (OWID 0060).png 850 × 600; 60 KB
-
 Annual-change-renewables (OWID 0057).png 850 × 600; 110 KB
-
 Annual-change-solar (OWID 0056).png 850 × 600; 104 KB
-
 Annual-change-wind (OWID 0054).png 850 × 600; 101 KB
-
 Annual-co-emissions-by-region (OWID 0055).png 850 × 600; 81 KB
-
 Annual-co-emissions-by-region.png 3,400 × 2,700; 764 KB
-
 Annual-co-emissions-from-other-industry (OWID 0053).png 850 × 600; 87 KB
-
 Annual-co2-cement (OWID 0052).png 850 × 600; 48 KB
-
 Annual-co2-coal (OWID 0051).png 850 × 600; 97 KB
-
 Annual-co2-emissions-by-region.png 3,400 × 2,400; 705 KB
-
 Annual-co2-emissions-per-country (OWID 0048).png 850 × 600; 65 KB
-
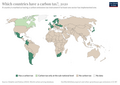
 Annual-co2-emissions-per-country-map.png 3,400 × 2,400; 793 KB
-
 Annual-co2-flaring (OWID 0050).png 850 × 600; 93 KB
-
 Annual-co2-gas (OWID 0049).png 850 × 600; 95 KB
-
 Annual-co2-including-land-use (OWID 0044).png 850 × 600; 112 KB
-
 Annual-co2-oil (OWID 0046).png 850 × 600; 94 KB
-
 Annual-deforestation.svg 850 × 600; 168 KB
-
 Annual-forest-expansion (OWID 0045).png 850 × 600; 121 KB
-
 Annual-percentage-change-coal (OWID 0105).png 850 × 600; 47 KB
-
 Annual-percentage-change-fossil-fuels (OWID 0104).png 850 × 600; 102 KB
-
 Annual-percentage-change-gas (OWID 0106).png 850 × 600; 97 KB
-
 Annual-percentage-change-hydro (OWID 0103).png 850 × 600; 49 KB
-
 Annual-percentage-change-low-carbon (OWID 0101).png 850 × 600; 52 KB
-
 Annual-percentage-change-nuclear (OWID 0102).png 850 × 600; 97 KB
-
 Annual-percentage-change-oil (OWID 0099).png 850 × 600; 45 KB
-
 Annual-percentage-change-renewables (OWID 0097).png 850 × 600; 106 KB
-
 Annual-percentage-change-solar (OWID 0098).png 850 × 600; 48 KB
-
 Annual-percentage-change-wind (OWID 0100).png 850 × 600; 101 KB
-
 Annual-primary-energy-fossil-vs-low-carbon (OWID 0096).png 850 × 600; 52 KB
-
 Annual-share-of-co2-emissions (OWID 0093).png 850 × 600; 84 KB
-
 Antarctic ozone hole area, OWID.svg 850 × 600; 8 KB
-
 Arable land use per person, OWID.svg 850 × 600; 21 KB
-
 Arctic-sea-ice-coverage-19352014 (OWID 0091).png 850 × 600; 61 KB
-
-
 Area-per-tonne-oil (OWID 0088).png 850 × 600; 61 KB
-
 Atmospheric CO₂ concentration, OWID.svg 850 × 600; 20 KB
-
 Average annual precipitation, OWID.svg 850 × 600; 143 KB
-
 Average monthly precipitation, OWID.svg 850 × 600; 141 KB
-
 Average temperature anomaly, OWID.svg 850 × 600; 10 KB
-
 Average-precipitation-per-year (1).png 3,400 × 2,400; 302 KB
-
 Average-precipitation-per-year (2).png 3,400 × 2,400; 289 KB
-
 Average-precipitation-per-year (OWID 0083).png 850 × 600; 105 KB
-
 Average-precipitation-per-year.png 3,400 × 2,400; 338 KB
-
 Battery-cost-learning-curve.png 1,773 × 2,106; 188 KB
-
 Battery-plugin-hybrid-vehicles (OWID 0082).png 850 × 600; 67 KB
-
 Beach-litter (OWID 0081).png 850 × 600; 92 KB
-
 Biofuel energy production, OWID.svg 850 × 600; 141 KB
-
 Biofuel production by region, OWID.svg 850 × 600; 37 KB
-
 Biofuel-production (OWID 0077).png 850 × 600; 62 KB
-
 Biofuels-production-by-region (OWID 0079).png 850 × 600; 73 KB
-
 Biomass-fish-stocks-region (OWID 0078).png 850 × 600; 81 KB
-
 Biomass-fish-stocks-taxa (OWID 0140).png 850 × 600; 62 KB
-
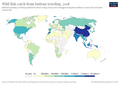 Bottom-trawling (OWID 0138).png 850 × 600; 104 KB
-
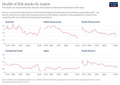
 But-so-is-the-quality-of-their-local-environment (OWID 0133).png 850 × 600; 98 KB
-
 But-so-is-the-quality-of-their-local-environment-finn (OWID 0134).png 850 × 600; 101 KB
-
 Carbon dioxide (CO₂) emissions by sector or source, OWID.svg 850 × 600; 17 KB
-
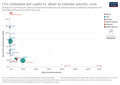
 Carbon dioxide emissions by income level, OWID.svg 850 × 600; 13 KB
-
 Carbon dioxide emissions by sector, OWID.svg 850 × 600; 14 KB
-
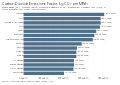 Carbon Dioxide Emissions Factor, kg CO₂ per MWh, OWID.svg 850 × 600; 9 KB
-
 Carbon emission intensity of economies, OWID.svg 850 × 600; 5 KB
-
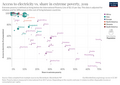
 Carbon emission intensity vs GDP per capita, OWID.svg 850 × 600; 44 KB
-
 Carbon emission intensity, OWID.svg 850 × 600; 27 KB
-
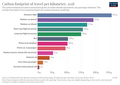
 Carbon footprint of protein foods.png 2,678 × 2,613; 313 KB
-
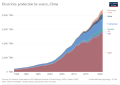
 Carbon-dioxide-emissions-are-higher-in-richer-countries (OWID 0127).png 850 × 600; 103 KB
-

-
 Carbon-dioxide-emissions-factor (OWID 0130).png 850 × 600; 78 KB
-
 Carbon-emissions-trading-system (OWID 0125).png 850 × 600; 100 KB
-
 Carbon-footprint-of-EU-diets-by-supply-chain.png 4,105 × 3,946; 452 KB
-
 Carbon-footprint-of-protein-foods-2.png 2,678 × 2,613; 411 KB
-
 Carbon-footprint-travel-mode (OWID 0123).png 850 × 600; 81 KB
-
 Carbon-footprint-travel-mode.png 3,400 × 2,956; 764 KB
-
 Carbon-intensity-electricity.svg 850 × 600; 167 KB
-
 Carbon-intensity-vs-gdp (OWID 0124).png 850 × 600; 96 KB
-
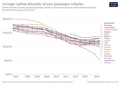 Carbon-new-passenger-vehicles (OWID 0122).png 850 × 600; 115 KB
-
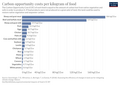 Carbon-opportunity-costs-per-kilogram-of-food (OWID 0120).png 850 × 600; 92 KB
-
 Carbon-tax-instruments (OWID 0119).png 850 × 600; 100 KB
-
 Carbon-tax-trading-coverage (OWID 0118).png 850 × 600; 106 KB
-
 Change-co2-annual-pct (OWID 0165).png 850 × 600; 101 KB
-
 Change-forest-area-share-total (OWID 0162).png 850 × 600; 116 KB
-
 Change-forest-vs-gdp (OWID 0161).png 850 × 600; 102 KB
-
 Change-in-cfc-11-concentrations (OWID 0157).png 850 × 600; 69 KB
-
 Change-in-total-mangrove-area (OWID 0159).png 850 × 600; 92 KB
-
 Change-marine-mammals (OWID 0158).png 850 × 600; 66 KB
-
 China-CO2-by-source.svg 850 × 600; 70 KB
-
 China-electricity-prod-source-stacked.svg 850 × 600; 39 KB
-
 China-energy-consumption-by-source.svg 850 × 600; 46 KB
-
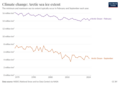 Climate change - Arctic sea ice extent.png 3,400 × 2,400; 445 KB
-
 Co-emissions-by-sector (OWID 0151).png 850 × 600; 74 KB
-
 Co-emissions-by-sector.png 3,400 × 2,400; 520 KB
-
 Co-emissions-per-capita (OWID 0144).png 850 × 600; 102 KB
-
 Co-emissions-per-capita-map.png 3,400 × 2,700; 913 KB
-
-
 Co-emissions-per-capita-vs-population-growth (OWID 0148).png 850 × 600; 97 KB
-
-
 CO2 emissions Argentina.svg 850 × 600; 37 KB
-
 CO2 emissions Germany.svg 850 × 600; 46 KB
-
 CO2 emissions Indonesia.svg 850 × 600; 37 KB
-
 CO2 emissions Italy.svg 850 × 600; 40 KB
-
 CO2 emissions Japan.svg 850 × 600; 39 KB
-
 CO2 emissions Mexico.svg 850 × 600; 37 KB
-
 CO2 emissions Netherlands.svg 850 × 600; 42 KB
-
 CO2 emissions Nigeria.svg 850 × 600; 34 KB
-
 CO2 emissions Norway.svg 850 × 600; 42 KB
-
 CO2 emissions of Brazil.svg 850 × 600; 36 KB
-
 CO2 emissions of China.svg 850 × 667; 37 KB
-
 CO2 Emissions of France.svg 850 × 600; 44 KB
-
 CO2 emissions of Romania.svg 850 × 600; 40 KB
-
 CO2 emissions Pakistan.svg 850 × 600; 31 KB
-
 CO2 emissions per capita, 2016 (Our World in Data).svg 850 × 600; 155 KB
-
 CO2 emissions per capita, 2017 (Our World in Data).svg 850 × 600; 155 KB
-
 CO2 emissions Saudi Arabia.svg 850 × 600; 33 KB
-
 CO2 emissions South Korea.svg 850 × 600; 35 KB
-
 CO2 emissions Spain.svg 850 × 600; 43 KB
-
 CO2 emissions USA.svg 850 × 600; 45 KB
-
 CO2 emissions vs GDP.svg 850 × 600; 60 KB
-
 CO2 reductions needed to keep global temperature rise below 2C 1950 - 2100.png 3,400 × 2,400; 1.04 MB
-
 CO2-by-source (OWID 0142).png 850 × 600; 58 KB
-
 Co2-deforestation-for-food (OWID 0143).png 850 × 600; 124 KB
-
 Co2-emissions-and-gdp (OWID 0200).png 850 × 600; 71 KB
-
 Co2-emissions-and-gdp-long-term (OWID 0141).png 850 × 600; 61 KB
-
 Co2-emissions-aviation (OWID 0198).png 850 × 600; 103 KB
-
 Co2-emissions-by-fuel-Italy.svg 850 × 600; 50 KB
-
 Co2-emissions-by-fuel-line (OWID 0196).png 850 × 600; 60 KB
-
 CO2-emissions-by-income-and-region-768x774.png 5,352 × 5,394; 821 KB
-
 Co2-emissions-domestic-aviation (OWID 0199).png 850 × 600; 102 KB
-
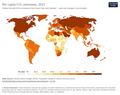
 CO2-emissions-per-capita-map.png 3,400 × 2,706; 1,002 KB
-
 CO2-emissions-per-capita.png 3,400 × 2,706; 767 KB
-
 Co2-emissions-transport (OWID 0197).png 850 × 600; 101 KB
-
 Co2-emissions-vs-gdp (OWID 0195).png 850 × 600; 94 KB
-
 Co2-gdp-growth (OWID 0193).png 850 × 600; 92 KB
-
 Co2-gdp-pop-growth (OWID 0194).png 850 × 600; 101 KB
-
 Co2-income-level (OWID 0192).png 850 × 600; 44 KB
-
 Co2-intensity.png 3,400 × 2,400; 862 KB
-
 Co2-international-aviation (OWID 0191).png 850 × 600; 101 KB
-
 Co2-land-use (OWID 0189).png 850 × 600; 108 KB
-
 Co2-land-use-global-share (OWID 0190).png 850 × 600; 106 KB
-
 Co2-land-use-per-capita (OWID 0187).png 850 × 600; 104 KB
-
 Co2-long-term-concentration.png 3,400 × 2,400; 655 KB
-
 Co2-mitigation-15c (OWID 0188).png 850 × 600; 146 KB
-
 Co2-mitigation-2c (OWID 0185).png 850 × 600; 146 KB
-
 Co2-per-capita-marimekko (OWID 0184).png 850 × 600; 75 KB
-
 Co2-per-capita-vs-renewable-electricity (OWID 0183).png 850 × 600; 100 KB
-
 Co2-per-unit-energy (OWID 0181).png 850 × 600; 86 KB
-
 Co2-transport-mode (OWID 0182).png 850 × 600; 70 KB
-
 Coal by end user in the United Kingdom, OWID.svg 850 × 600; 28 KB
-
 Coal consumption by region, OWID.svg 850 × 600; 20 KB


.png)

.png)


.png)

.png)
.png)
.png)
.png)

.png)
.png)
.png)

.png)


.png)
.png)
.png)
.png)
.png)
.png)


.png)
.png)

.png)
.png)
.png)
.png)
.png)
.png)
.png)
.png)
.png)
.png)

.png)
.png)
.png)

.png)

.png)
.png)
.png)
.png)

.png)
.png)
.png)
.png)
.png)
.png)
.png)
.png)
.png)
.png)
.png)
.png)


.png)

.png)


.png)
.png)
.png)


.png)
.png)


.png)
.png)
.png)
.png)
.png)
.png)
.png)
_emissions_by_sector_or_source,_OWID.svg)


.png)
.png)
.png)
.png)


.png)


.png)
.png)
.png)
.png)
.png)
.png)
.png)
.png)
.png)
.png)
.png)


.png)

.png)

.png)
.png)
.png)


.svg)
.svg)


.png)
.png)
.png)
.png)
.png)

.png)

.png)


.png)
.png)
.png)
.png)

.png)
.png)
.png)
.png)

.png)
.png)
.png)
.png)
.png)


.png)
.png)
.png)
.png)