Category:Our World in Data - Innovation and Technological Change
Jump to navigation
Jump to search
Media in category "Our World in Data - Innovation and Technological Change"
The following 72 files are in this category, out of 72 total.
-

-
 A long-term timeline of technology, OWID.png 2,456 × 3,261; 676 KB
-
 Adoption of communication technologies, World.png 3,400 × 2,400; 506 KB
-
 Broadband subscriptions per 100 people, OWID.svg 850 × 600; 11 KB
-
 Chess ability of the best computers.png 3,400 × 2,400; 446 KB
-
 Computing efficiency, OWID.svg 850 × 600; 6 KB
-
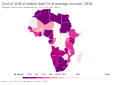 Cost of 1GB of mobile data (% of average income), OWID.svg 850 × 600; 139 KB
-
 Cost of sequencing a full human genome, OWID.svg 850 × 600; 5 KB
-
 Cost per Megabase (Mb) of human genome DNA sequencing, OWID.svg 850 × 600; 5 KB
-

-
-
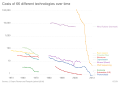 Costs of 66 different technologies over time, OWID.svg 850 × 600; 17 KB
-
-
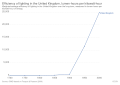
 Efficiency-lighting-uk-sources (OWID 0269).png 850 × 600; 46 KB
-

-

-
 Fixed broadband subscriptions (per 100 people), OWID.svg 850 × 600; 141 KB
-
 Fixed telephone subscriptions, OWID.svg 850 × 600; 141 KB
-
 Fixed-broadband-subscriptions-per-100-people.png 3,400 × 2,400; 807 KB
-
 Global-agri-productivity-growth (OWID 0473).png 850 × 600; 82 KB
-
 Historical cost of computer memory and storage.svg 822 × 483; 52 KB
-
 Historical-cost-of-computer-memory-and-storage OWID.png 3,400 × 2,400; 436 KB
-
 Historical-cost-of-computer-memory-and-storage OWID.svg 850 × 600; 26 KB
-
 Improved-weather-forecasting 7463.png 7,463 × 6,130; 787 KB
-
 Intensity error, OWID.svg 850 × 600; 12 KB
-
 Internet users by world region, OWID.svg 850 × 600; 12 KB
-
 Learning curve cycle.png 1,600 × 1,014; 135 KB
-
 Levelized-cost-of-energy (OWID 0573).png 850 × 600; 86 KB
-
 Microprocessor clock speed, OWID.svg 850 × 600; 6 KB
-
 Mobile and fixed landline telephone subscriptions, OWID.svg 850 × 600; 9 KB
-
 Mobile cellular subscriptions by country, OWID.svg 850 × 600; 142 KB
-
 Mobile cellular subscriptions, OWID.svg 850 × 600; 141 KB
-
 Mobile phone subscriptions vs. GDP per capita, OWID.svg 850 × 600; 32 KB
-
 Moore's Law - Transistors per microprocessor, OWID.svg 850 × 600; 6 KB
-
 Number of human genome base pairs sequenced per US$, OWID.svg 850 × 600; 5 KB
-
 Number of internet users by country, OWID.svg 850 × 600; 140 KB
-
 Number of mobile cellular subscriptions by country, OWID.svg 850 × 600; 18 KB
-
 Number of people employed in agriculture since 1800, OWID.svg 850 × 600; 15 KB
-
 Patents-electric-vehicles (OWID 0677).png 850 × 600; 75 KB
-
 Patents-energy-storage (OWID 0676).png 850 × 600; 61 KB
-
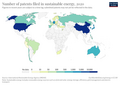
 Patents-filed-for-renewables (OWID 0672).png 850 × 600; 92 KB
-
 Patents-for-renewables-by-country (OWID 0675).png 850 × 600; 106 KB
-
 Percentage of individuals using the internet by country, OWID.svg 850 × 600; 10 KB
-
 Price-of-electricity-new-fossil-and-nuclear.png 2,426 × 3,035; 249 KB
-
 Price-of-electricity-new-renewables-vs-new-fossil-no-geo.png 2,426 × 3,747; 362 KB
-
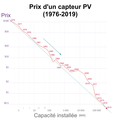 Prix d'un capteur photovoltaïque (1976-2019).png 2,000 × 2,100; 240 KB
-
 Research & development spending as a share of GDP.png 3,400 × 2,400; 837 KB
-
 Research-and-development-expenditure-of-gdp.png 3,400 × 2,400; 786 KB
-
 Research-spending-gdp.png 3,400 × 2,400; 826 KB
-
 Researchers in R&D per million people, OWID.svg 850 × 600; 140 KB
-
 Scientific and technical journal articles, OWID.svg 850 × 600; 141 KB
-

-
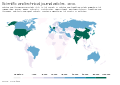
 Scientific-publications-per-million.png 3,400 × 2,400; 826 KB
-
 Secure Internet servers, OWID.svg 850 × 600; 141 KB
-
 Share of individuals using the internet.png 3,400 × 2,400; 770 KB
-
 Share of population covered by the internet, OWID.svg 850 × 600; 140 KB
-

-

-
 Share of the population using the Internet, OWID.svg 850 × 600; 141 KB
-
 Solar PV module prices vs. cumulative capacity, OWID.svg 850 × 600; 11 KB
-
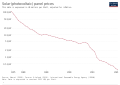
 Solar PV module prices, OWID.svg 850 × 600; 6 KB
-
 Solar PV module prices.svg 850 × 600; 29 KB
-
 Solar PV system costs, OWID.svg 850 × 600; 7 KB
-
 Solar-pv-prices (OWID 1086).png 850 × 600; 48 KB
-
 Solar-pv-prices-vs-cumulative-capacity.png 1,998 × 2,058; 290 KB
-
 Spending on research and development as share of GDP, OWID.svg 850 × 600; 141 KB
-
 Supercomputer Power (FLOPS), OWID.svg 850 × 600; 6 KB
-
 Technology adoption in US households, OWID.svg 850 × 600; 18 KB
-
 Technology and infrastructure diffusion in the US, OWID.svg 850 × 600; 19 KB
-

-
 Timeline of artificial intelligence training computation for the last 8 decades.png 2,079 × 2,560; 591 KB
-
 Track error, OWID.svg 850 × 600; 12 KB


,_OWID.svg)

_of_human_genome_DNA_sequencing,_OWID.svg)
.png)
.png)


.png)
.png)
_telephone_subscriptions_vs._GDP_per_capita,_OWID.svg)
,_OWID.svg)


.png)


.png)


.png)
.png)
.png)
.png)


.png)


.png)


,_OWID.svg)


