Category:Weather maps of the United States
Jump to navigation
Jump to search
Weather maps, including surface weather analyses, of the United States. See also Category:Climate maps of the United States.
Subcategories
This category has the following 11 subcategories, out of 11 total.
1
- 1995 Chicago heat wave (3 F)
M
- Weather maps of Minnesota (9 F)
N
- NOAA Weather Radio coverage maps (28 F)
S
W
Pages in category "Weather maps of the United States"
This category contains only the following page.
Media in category "Weather maps of the United States"
The following 200 files are in this category, out of 222 total.
(previous page) (next page)-
 01 09 24 Trough.gif 800 × 600; 55 KB
-
 05 September 2014 near detroit weather.png 862 × 599; 1.17 MB
-
 1-19-1977 weather map.jpg 667 × 499; 66 KB
-
 10 PM March 12 surface analysis of Great Blizzard of 1888.png 915 × 1,267; 616 KB
-
 147 of 'Elementary Physical Geography' (11143358465).jpg 827 × 741; 140 KB
-
 1858 California hurricane.png 761 × 518; 170 KB
-

-
 1947 October 12 0630 UTC daily weather map.png 789 × 576; 621 KB
-
 1947 October 15 0630 UTC daily weather map.png 828 × 710; 833 KB
-
 1988 Southern U.S. snowstorm accumulation map.jpg 939 × 599; 153 KB
-
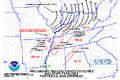
 1995jul12-13rpts.jpg 600 × 337; 36 KB
-
 2007-08 Winter Snowfall in Wisconsin.png 833 × 1,000; 65 KB
-
 2008 noaa cold year.tiff 454 × 327; 286 KB
-
 2011–12 United States winter average temperature anomaly.gif 650 × 490; 74 KB
-
 2011–12 United States winter percent of average precipitation.gif 650 × 491; 85 KB
-
 2014–15 United States winter average temperature anomaly.png 1,052 × 744; 109 KB
-
 2015-16WinterTemperatures.gif 650 × 490; 74 KB
-
 2016 Connecticut Drought Map.png 1,056 × 816; 25 KB
-
 2019 United States tornado touchdowns.png 1,018 × 710; 35 KB
-
 2020-21 North American winter temperature anomalies.png 650 × 489; 575 KB
-
 2021 U.S. Tornadoes map.jpg 3,181 × 2,219; 1.55 MB
-
 2021 WPC Mid-November winter storm forecast track map.gif 1,116 × 839; 29 KB
-
 203739 5day cone with line and wind.png 897 × 736; 86 KB
-
 28Aug1990 2pm surface map.png 560 × 427; 308 KB
-
 302 of 'Eclectic Physical Geography' (11291655046).jpg 1,315 × 946; 261 KB
-
 333 of 'North America, its agriculture and climate' (11052662496).jpg 1,376 × 1,358; 401 KB
-
 338 of 'North America, its agriculture and climate' (11052318956).jpg 1,392 × 1,303; 380 KB
-
 344 of 'North America, its agriculture and climate' (11052339783).jpg 1,360 × 1,361; 392 KB
-
 345 of 'North America, its agriculture and climate' (11052927863).jpg 1,344 × 1,362; 401 KB
-
 369 of 'North America, its agriculture and climate' (11051428844).jpg 1,370 × 2,466; 794 KB
-
 402 of 'North America, its agriculture and climate' (11052264096).jpg 1,328 × 1,330; 366 KB
-
 403 of 'North America, its agriculture and climate' (11051320444).jpg 1,440 × 1,371; 426 KB
-
 500 Mb Height Contours.png 1,113 × 819; 1.4 MB
-
 500-mb pressure chart 2021-06-28 700EST Heat dome Pacific NW.gif 882 × 629; 36 KB
-
 500-mb pressure chart 2021-06-28 700EST Heat dome Pacific NW.png 1,040 × 780; 83 KB
-

-
 500mb Height Field & 2m Temperature at 0z September 6th, 2000.jpg 812 × 546; 395 KB
-

-

-

-

-
 Absolute Humidity for July 1876-1886 Map.jpg 3,489 × 2,930; 2.24 MB
-
 Alaska permafrost zones.jpg 1,603 × 980; 306 KB
-
 Annual tornado watch frequency in the United States.svg 555 × 352; 1.29 MB
-
 April41966sfcanalysis 1.png 1,363 × 674; 1.54 MB
-
 Atmosphere pressure map on December 22, 1989 - cold wave.jpg 1,000 × 741; 335 KB
-
 Atmospheric conditions Leap Day 1952.png 517 × 346; 325 KB
-
August 2020 Derecho - Expanded.webm 7.5 s, 1,332 × 634; 3.62 MB
-
 Average Annual Tornado Reports.jpg 1,725 × 1,100; 483 KB
-
 Average Date of First Killing Frost.jpg 2,955 × 2,195; 1.65 MB
-
 Average Date of Last Killing Frost.jpg 2,958 × 2,264; 1.74 MB
-
 Bell telephone magazine (1922) (14776694803).jpg 3,056 × 2,226; 1.57 MB
-
 Caheatwave geos5 2022249.jpg 720 × 665; 407 KB
-
 Cloud cover analysis 1959 Spac0036-repair.jpg 1,652 × 1,154; 307 KB
-
 Clravt 20220717 20220723 USA.png 4,400 × 3,400; 1.31 MB
-
 Clrmax 20220717 20220723 USA.png 4,400 × 3,400; 1.61 MB
-
 Clrtanom 20220717 20220723.png 6,600 × 5,100; 2.22 MB
-
 Cltrain 20220717 20220723 USA.png 6,600 × 5,100; 2.87 MB
-
 Cold Sunday 1982-01-17 temperature map.png 979 × 661; 220 KB
-
 Cold Sunday 1982-01-17 weather map.png 2,551 × 1,920; 686 KB
-
 Cold temperatures over North America Dec 28 2017.png 1,024 × 829; 205 KB
-
 ColdAirDamming.png 481 × 697; 339 KB
-
 Columbus Day Storm 1962-10-13 weather map.png 666 × 815; 458 KB
-
 ColumbusDayStormPeakGustMap.jpg 508 × 625; 115 KB
-
 Corn Belt Derecho Path.png 765 × 424; 27 KB
-
 Daily weather map (34333420604).jpg 2,000 × 1,590; 2.95 MB
-
 Day5pressureforecast.png 1,024 × 613; 42 KB
-
 Dec 26 2017—Jan 2 2018 temperature anomalies over North America.jpg 646 × 496; 147 KB
-
Derecho 08May09 mesonet 640x480.ogv 38 s, 640 × 480; 28.09 MB
-
Derecho-Aug2020-Animated.webm 5.5 s, 1,084 × 754; 6.72 MB
-
 Direct normal solar radiation 2004.jpg 1,501 × 1,164; 286 KB
-
 Early February 2022 winter storm forecast track.gif 1,116 × 839; 32 KB
-
 February 2015 average temperature departures in the United States.gif 1,052 × 744; 131 KB
-
 February 2021 United States temperature anomalies V2.png 1,000 × 690; 365 KB
-
 February 21, 1971, 1200 UTC surface analysis.jpg 508 × 415; 47 KB
-
 February 21, 1971, 1200 UTC upper-air analysis.jpg 789 × 660; 120 KB
-
 Gail Weather Alerts.png 1,407 × 1,504; 196 KB
-
 GFS Arctic cold temperatures over North America on January 1, 2018.png 1,920 × 1,080; 550 KB
-
 Great Blizzard 1978-01-26 weather map.png 1,316 × 914; 314 KB
-
 Great Blizzard of 1899 Sfc map.png 632 × 431; 642 KB
-
 Great Blizzard of 1899 temperature map.gif 650 × 500; 227 KB
-
 Great Lakes surface weather analysis at 00 UTC on 12 April 1965.png 694 × 482; 224 KB
-
 Ground meteorological condition.png 860 × 602; 298 KB
-
 Halloween Blizzard 1991.jpg 751 × 572; 156 KB
-
 Handbook of Meteorology-160.jpg 2,381 × 1,690; 663 KB
-
 Handbook of Meteorology-166.jpg 2,791 × 1,742; 418 KB
-
 Handbook of Meteorology-260.jpg 2,782 × 1,730; 434 KB
-
 Hann Atlas der Meteorologie 5.jpg 1,180 × 975; 414 KB
-
 Harry Volkman WGN TV.jpg 980 × 604; 184 KB
-

-
 Hurricane Cindy surface analysis 07081959.png 1,145 × 1,432; 2.18 MB
-
 Ifr.gif 940 × 675; 35 KB
-

-
 Irene cumulative wind history.gif 895 × 716; 34 KB
-
 Isobar Map (PSF).png 4,068 × 2,691; 352 KB
-
 Isohyet.jpg 1,050 × 638; 287 KB
-
 Isohyet.png 1,050 × 638; 101 KB
-
 Isotherm - Meteorology (PSF).png 3,566 × 2,050; 458 KB
-
 January 17 1982 500-Millibar Height Contours.png 1,554 × 1,314; 368 KB
-
 January 2007 western US freeze.gif 303 × 420; 57 KB
-
 January 21, 1985 temperature map.jpg 950 × 596; 67 KB
-

-
 July 8, 1896 hurricane 1 weather map.jpg 1,736 × 1,737; 2.71 MB
-
 July TD 1956 track.png 2,700 × 1,669; 4.19 MB
-
 Kay vir 2022251.jpg 720 × 741; 181 KB
-
 List of United States tornadoes from June to July 2014.png 1,294 × 806; 624 KB
-
 Low temperatures on November 11–12, 1911.png 821 × 512; 39 KB
-
 Mac1982100509GMS2IR.jpg 497 × 306; 39 KB
-
 Manualfcst36hrs.gif 750 × 562; 32 KB
-
 Map of Christmas Snowstorm December 22-24, 1989.png 903 × 1,200; 813 KB
-
 Maximum temperature map of the United States.jpg 3,495 × 2,938; 2.16 MB
-
 May 30-31 1998 derecho.jpg 600 × 267; 36 KB
-
 Mean monthly average temperature (34791550680).jpg 2,000 × 1,577; 2.41 MB
-
 Mesoscale analysis February 25, 2022.png 803 × 597; 149 KB
-
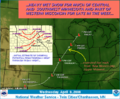
 Meteorological setup of the 1999 Oklahoma tornado outbreak.gif 1,124 × 996; 59 KB
-
 Midwest US surface weather analysis 1975-05-06 2100Z.png 1,750 × 1,294; 167 KB
-
 Minimum temperature map of the United States.jpg 3,477 × 2,936; 2.1 MB
-
 Monsoonmapb.JPG 669 × 581; 49 KB
-
 NA monsoon map.gif 1,338 × 1,162; 98 KB
-
 NASABlizzard2006.jpg 3,592 × 2,352; 1.22 MB
-
 NEFlooding2005.gif 650 × 496; 42 KB
-
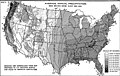
 NIE 1905 Meteorology - weather map for April 3, 1892, 8 a.m.jpg 1,489 × 943; 408 KB
-
 NIE 1905 Meteorology - weather map for April 4, 1892, 8 a.m.jpg 1,511 × 955; 455 KB
-
 NOAA Temp July20 8pmEDT.png 515 × 424; 49 KB
-
 Noaa-outbreak-graphic.png 765 × 511; 56 KB
-
 NOAA33trk.JPG 1,453 × 2,002; 440 KB
-
 North America C Current.jpg 1,074 × 512; 157 KB
-
 NREL USA CSP map hi-res 2008.jpg 8,800 × 6,800; 8.71 MB
-
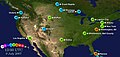
 NREL USA CSP map lo-res 2008.jpg 792 × 612; 112 KB
-
 NREL USA PV map hi-res 2008.jpg 8,800 × 6,800; 5.63 MB
-
 NREL USA PV map lo-res 2008.jpg 792 × 612; 111 KB
-
 NWS Boston Snowfall 20220107.png 1,111 × 757; 471 KB
-
 NWS Kentucky Flooding Map for the 2022 Eastern Kentucky floods.jpg 1,100 × 850; 204 KB
-
 NWS Little Rock Service Area.png 420 × 566; 20 KB
-
 NWS Weather Map Example 2.png 644 × 595; 251 KB
-
 NWS-2020Aug10-Derecho-Radar-Map.png 1,423 × 669; 1.49 MB
-
 NWS-2020Aug10-Derecho-Summary-Map.png 960 × 540; 523 KB
-
 NWS-2020Aug10-Derecho-Wind-Map.jpg 1,280 × 720; 214 KB
-

-
 Isothermal chart of the region north of the 36th parallel &c. &c. between the Atlantic & Pacific ocean (NYPL b20643848-5387016).tiff 10,328 × 7,760, 2 pages; 229.57 MB
-
 Observed ice accretion from Late October 2020 ice storm.jpg 980 × 551; 70 KB
-
 October surface analysis.gif 1,280 × 720; 3.86 MB
-
 October surface analysis2.gif 1,280 × 720; 3.02 MB
-
 Ontario-Adirondacks derecho July 14-15 1995.jpg 600 × 355; 33 KB
-
 Opcwaveanalysis.gif 1,024 × 819; 338 KB
-
 Panhandle hook.png 652 × 540; 113 KB
-
-
 PSM V53 D325 Showing isobars and wind lines.png 1,737 × 1,104; 191 KB
-
 PSM V53 D326 Showing the origins of the highs and their paths.png 1,731 × 1,092; 162 KB
-
 PSM V53 D327 Showing the origins and paths of storms.png 1,726 × 1,103; 182 KB
-
 PSM V53 D328 A newspaper weather map.png 1,840 × 1,154; 242 KB
-
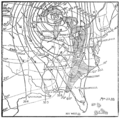
 PSM V58 D396 Cyclone chart of sept 18 1900 at 8am.png 1,437 × 1,318; 226 KB
-
 PSM V58 D397 Cyclone pattern and changing temperatures of nov 22 1898.png 1,464 × 1,439; 302 KB
-
 PSM V58 D398 Cyclone pattern following the sun.png 1,442 × 1,429; 213 KB
-
 PSM V58 D399 Summer hurricane patterns over eastern us.png 1,452 × 1,211; 206 KB
-
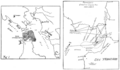 PSM V59 D546 Conditions at the time of the sinking of the city rio de janeiro.png 1,732 × 1,015; 102 KB
-
 Radar loop Dec 16 storm.gif 633 × 475; 429 KB
-
 Rainfall, March 23-27, 1913 (51806765503).jpg 6,242 × 3,999; 19.11 MB
-
 Redoubt-third-doppler.gif 600 × 550; 225 KB
-
 Severe Weather Bulletin 27.gif 824 × 728; 20 KB
-
 Sfc map 20230405.png 1,088 × 783; 147 KB
-
 Sfc188601090730AM.png 812 × 597; 1.07 MB
-
 Snow Totals.jpg 2,030 × 2,632; 1.53 MB
-
 Snowcsi fr.png 1,000 × 678; 163 KB
-
 Statewidepcpnrank-201903-201905.png 650 × 475; 478 KB
-
 Storm total rainfall for Hurricane Nine, 1947.png 914 × 1,150; 166 KB
-
 Storm Total Snow Accumulation during the February 08-09, 2013 Blizzard.gif 938 × 1,039; 43 KB
-
 Summer in March 2012 North America.png 1,800 × 1,800; 2.95 MB
-

-
 Surface analysis.gif 640 × 480; 26 KB
-
 Surface map of the United States October 30 1991.png 1,138 × 888; 2.07 MB
-
 Surface weather analysis Central-South US 2009-02-11.gif 750 × 562; 29 KB
-
 Synoptic weather.gif 407 × 281; 30 KB
-
 Temp Northeast Map.JPG 840 × 695; 102 KB
-
 Temp South and Midwest.JPG 461 × 732; 66 KB
-
 Temp West map.JPG 885 × 758; 90 KB
-
 Temperature USA mesoscale analysis.png 515 × 424; 90 KB
-
 The National geographic magazine (1902) (14758861796).jpg 2,088 × 1,584; 513 KB
-
 The Ridiculously Resilient Ridge.pdf 747 × 416; 200 KB
-
 The Ridiculously Resilient Ridge.svg 800 × 445; 262 KB
-
 Tornado activity.png 800 × 587; 69 KB
-
 Tornado outbreak of March 18, 1925.gif 1,701 × 1,501; 129 KB
-
 TX-NM storm Nov 24-2007.jpg 512 × 293; 45 KB
-
 United State Surface Map on January 18th, 1994.png 1,194 × 886; 1.5 MB
-
 United States surface analysis May 6, 1964.jpg 2,207 × 1,896; 571 KB
-
 United States Surface Map on January 19, 1994.png 1,172 × 892; 1.54 MB
-
 Upper air analysis at 00 UTC on 12 April 1965.gif 571 × 399; 165 KB
-

-
 US flood map 2008-06-10.jpg 529 × 364; 65 KB
-
 US precip outlook winter 2018–19 NOAA.png 2,100 × 1,380; 818 KB
-
 US precip outlook winter 2019–20 NOAA.png 2,099 × 1,379; 761 KB
-
 Us pv annual may2004.jpg 1,501 × 1,164; 263 KB
-
 US states with reported cryoseisms.PNG 841 × 580; 19 KB
-
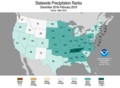 US Statewide Precipitation Ranks Winter 2019.png 650 × 475; 479 KB
-
 US temperatures on January 15, 2024.png 515 × 424; 99 KB
-
 US Weather map from 1872.jpg 1,852 × 1,200; 3.43 MB
-
 US weather map, 10 Nov 1913.png 1,000 × 600; 299 KB
-
 US weather map, 5 Nov 1913.png 1,000 × 584; 226 KB
-
 US weather map, 6 Nov 1913.png 1,000 × 579; 186 KB
-
 US weather map, 7 Nov 1913.png 1,000 × 570; 213 KB


.jpg)

.jpg)


.jpg)
.jpg)
.jpg)
.jpg)
.jpg)
.jpg)
.jpg)
.jpg)


%27_(11169816453).jpg)
%27_(11169513125).jpg)
%27_(11169788166).jpg)
%27_(11166183876).jpg)


_(14776694803).jpg)


.jpg)


.png)


.png)


.png)


.jpg)


.jpg)


_(20618450509).jpg)


.jpg)


_(14758861796).jpg)


