Category:Temporal population graphs of Germany
Jump to navigation
Jump to search
Subcategories
This category has the following 16 subcategories, out of 16 total.
B
H
L
M
N
R
S
T
Media in category "Temporal population graphs of Germany"
The following 25 files are in this category, out of 25 total.
-
 Bev DDR mit histor Ereignissen.png 855 × 441; 30 KB
-
 Bev DDR zh.png 855 × 441; 46 KB
-
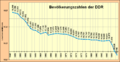 Bev DDR.png 855 × 441; 13 KB
-
 Bevölkerungsentwicklung in Deutschland (Nationalität).svg 1,350 × 810; 95 KB
-
 Demografio de Germanio.png 887 × 548; 18 KB
-
 Deutschland Demografie.png 887 × 548; 19 KB
-

-
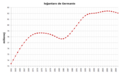
 Einwohnerentwicklung von Deutschland.svg 800 × 400; 51 KB
-
 Einwohnerentwicklung von Wanne-Eickel (log10).svg 800 × 400; 66 KB
-
 Entwicklung der Einwohnerzahlen Deutschlands.png 970 × 604; 11 KB
-
 Entwicklung der Einwohnerzahlen in Deutschland.JPG 970 × 604; 64 KB
-
 Bevölkerungsentwicklung DDR.svg 1,350 × 810; 54 KB
-
 Deutschland Bevölkerung.svg 1,350 × 810; 76 KB
-
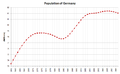 Germany demography.png 887 × 548; 28 KB
-
 Population of Germany.svg 1,350 × 810; 72 KB
-
 Germany demography blank.png 887 × 548; 13 KB
-
 Germany demography.svg 750 × 450; 10 KB
-
 Germany population.svg 800 × 400; 28 KB
-
 Grossbrembach-population-1994-2017.png 1,487 × 806; 36 KB
-
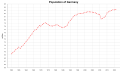
 Popolazione del territorio tedesco 1880 2000.png 970 × 604; 59 KB
-
 Population development of Germany (Nationality).svg 1,350 × 810; 81 KB
-
 Population of German territories 1800 - 2000.JPG 970 × 604; 63 KB
-
 Естественное движение Германии 1950-2015.png 1,841 × 837; 88 KB
-
 СКР Германии.png 1,315 × 746; 51 KB
-
 СКР по гражданству.png 1,396 × 731; 54 KB


.svg)


.svg)

.svg)


.svg)


