Category:Temporal population graphs of Poland
Jump to navigation
Jump to search
Media in category "Temporal population graphs of Poland"
The following 25 files are in this category, out of 25 total.
-
 Bevoelkerungsentwicklung Polen.svg 544 × 388; 64 KB
-
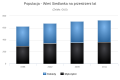
 Białystok population and gender composition.svg 525 × 475; 35 KB
-
 Brdów - ludnośc.jpg 629 × 329; 32 KB
-
 Crescita Demografica Sosnowiec.JPG 822 × 393; 38 KB
-
 Demography of Białystok.png 790 × 400; 17 KB
-
 Einwohnerentwicklung der Stadt Katowice.svg 800 × 400; 27 KB
-
 Einwohnerentwicklung Kattowitz.svg 469 × 281; 37 KB
-
 Liczba mieszkańców Goleniowa.png 1,347 × 581; 39 KB
-
 Ludnosc olecka.PNG 2,448 × 1,027; 86 KB
-
 Ludnosc zgorzelca 1946-2006.PNG 929 × 583; 94 KB
-
 Ludność Piły.png 1,056 × 471; 15 KB
-
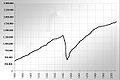
 Poland-demography 1946-2008.png 1,465 × 865; 37 KB
-
 Poland-demography.png 725 × 426; 11 KB
-
 Poland population.svg 750 × 450; 10 KB
-
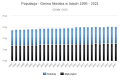 Populacja gminy Niwiska w latach 1996-2021.svg 600 × 400; 22 KB
-
 Populacja karlino.png 1,200 × 800; 81 KB
-
 Populacja Siedlanki w latach 1998-2011.svg 600 × 400; 8 KB
-
 PopulacjaGoleniowa.jpg 772 × 414; 40 KB
-
 Population of Poland.svg 659 × 384; 66 KB
-
 Population of Warsaw, 1700-2009.png 779 × 422; 965 KB
-
 Population of Warsaw, 1880 - 2000.jpg 1,200 × 800; 118 KB
-
 Počet obyvatel Čenstochové.png 1,828 × 386; 32 KB
-
 Racibórz-wykres demograficzny.png 970 × 604; 15 KB
-
 Liczba ludności.jpg 2,050 × 1,530; 262 KB
-
 Wroclaw demography.png 603 × 411; 11 KB


