Category:Solar energy statistics of the United States
Jump to navigation
Jump to search
Media in category "Solar energy statistics of the United States"
The following 85 files are in this category, out of 85 total.
-
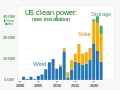 2000- Clean power installation - wind, solar, storage - US.svg 1,000 × 750; 3 KB
-

-

-
 2014 Monthly Solar Generation for NC.png 480 × 289; 12 KB
-
 2014 NC Solar Electric Profile.png 504 × 342; 11 KB
-
 2014 Solar PV Electric Energy Generation Profile.png 504 × 342; 11 KB
-
 2014 Solar Thermal Electric Energy Generation Profile.png 504 × 342; 11 KB
-
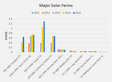 2015 Major Solar Farms.png 507 × 348; 16 KB
-
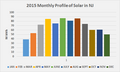
 2015 Monthly Profile of Solar Energy for NV.png 481 × 289; 13 KB
-
 2015 Monthly Profile of Solar for NJ.png 481 × 289; 13 KB
-
 2015 Monthly Solar Energy Profile for CA.png 481 × 289; 13 KB
-
 2015 Monthly Solar Generation for NC.png 481 × 289; 12 KB
-
 2015 Monthly Solar Profile for AZ.png 481 × 289; 13 KB
-
 2015 Profile for Solar Thermal generated Electric Energy.jpg 480 × 289; 31 KB
-
 2015 Profile of Solar PV Generated Electric Energy.jpg 480 × 289; 32 KB
-
 2015 Solar projects Capacity Factors.png 472 × 324; 15 KB
-
 2015 Solar PV Electric Energy Generation Profile.png 507 × 338; 12 KB
-
 2015 Solar Thermal Electric Energy Generation Profile.png 507 × 338; 11 KB
-
 2015 Top Five Solar States.png 480 × 288; 6 KB
-
-
 2016 Profile of US Electric Energy Produced by Solar PV.jpg 480 × 289; 31 KB
-
 2016 Profile of US Electric Energy Produced by Solar Thermal.jpg 480 × 289; 37 KB
-
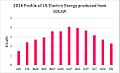 2016 Profile of US Electric Energy produced by SOLAR.jpg 481 × 296; 32 KB
-
 2016 Top Five States for Distributed Solar.jpg 480 × 301; 22 KB
-
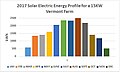 2017 15KW Vermont Farm Solar Energy Generation Profile.jpg 484 × 289; 31 KB
-
 2017 AZ Solar Eneregy Generation Profile.jpg 484 × 289; 32 KB
-
 2017 CA Solar Energy Generation Profile.jpg 484 × 289; 32 KB
-
 2017 NC Solar Energy Generation Profile.jpg 484 × 288; 34 KB
-
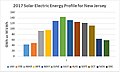 2017 NJ Solar Energy Generation Profile.jpg 484 × 289; 34 KB
-
 2017 NV Solar Energy Generation Profile.jpg 484 × 289; 33 KB
-
 2017 Solar Generation by State.jpg 484 × 400; 29 KB
-
 2017 TX Solar Energy Generation Profile.jpg 484 × 289; 31 KB
-
 2017 VT Solar Energy Generation Profile.jpg 484 × 289; 30 KB
-

-
 AEO 2012 Growth Projection for US Wind and Solar.png 1,200 × 360; 34 KB
-
 AEO 2013 Growth Projection for US Wind and Solar.png 1,200 × 360; 22 KB
-
 AEO 2013 Projection for US Wind and Solar-semilog.png 1,024 × 768; 34 KB
-
 AEO 2013 Projection for US Wind and Solar.png 1,024 × 768; 40 KB
-
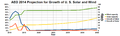 AEO 2014 Growth Projection for US Wind and Solar.png 1,200 × 360; 27 KB
-
 AEO 2015 Growth Projection for US Wind and Solar.png 1,200 × 360; 27 KB
-
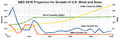 AEO 2016 Growth Projection for US Wind and Solar.png 1,200 × 400; 33 KB
-
 AEO wind and solar capacity projections.png 1,024 × 768; 33 KB
-
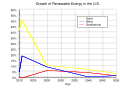 Annual Growth of Renewable Energy in the US.svg 750 × 560; 10 KB
-

-
 AZ Solar Profile 2014.png 481 × 342; 10 KB
-
 Boston MA DaylightChart.png 969 × 685; 46 KB
-
 CA Solar Profile 2014.png 481 × 342; 11 KB
-
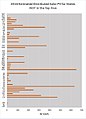
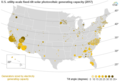
 Estimated Distributed Solar by States with less than 600 M kWh.png 481 × 726; 15 KB
-
 Major Solar Farms.jpg 480 × 289; 38 KB
-
 Major US Solar Farms.png 504 × 349; 16 KB
-
 Minor Solar Farms.jpg 502 × 289; 41 KB
-
 Monthly Solar Distributed 2015.png 507 × 338; 12 KB
-

-
 NJ Solar Profile 2014.png 481 × 342; 11 KB
-
 NV Solar Energy Profile 2014.png 481 × 342; 11 KB
-
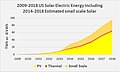 Solar Electric Energy including Small.jpg 484 × 289; 33 KB
-
 Solar Plant Capacity Factors.jpg 480 × 289; 41 KB
-
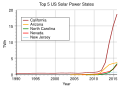
 Top 5 Solar States.png 2,125 × 1,450; 30 KB
-
 Top Five Solar States 2016.jpg 480 × 289; 30 KB
-
 Top Five States for Distributed Solar.png 481 × 289; 7 KB
-
 Top Five US Solar States.svg 750 × 560; 14 KB
-

-
-

-

-
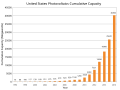 United States Photovoltaics Installed Capacity.svg 800 × 600; 8 KB
-
 United States Wind and Solar Generation Percentage-semilog.svg 800 × 600; 12 KB
-
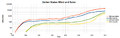 United States Wind and Solar semilog.png 1,600 × 500; 26 KB
-
 US annual increase in renewable energy AEO 2015.png 1,024 × 768; 39 KB
-
 US Monthly Solar Capacity Factors.png 2,100 × 1,425; 35 KB
-
 US Monthly Solar Capacity Factors.svg 750 × 560; 10 KB
-
 US monthly solar electricity generation.png 1,024 × 768; 37 KB
-
 US Monthly Solar Power Generation.png 1,024 × 768; 30 KB
-
 US Monthly Solar Power Generation.svg 1,200 × 800; 14 KB
-
 US Solar Electricity Production.png 1,024 × 768; 19 KB
-
 US Solar Electricity Production.svg 1,200 × 800; 15 KB
-
 US Solar Generation 2008.png 1,050 × 360; 16 KB
-
 US Solar Generation 2012.png 1,050 × 360; 15 KB
-
 US Solar Generation-2013.svg 800 × 300; 38 KB
-
 US Solar Generation-2014.svg 800 × 300; 38 KB
-
 US Solar Generation-2015.svg 800 × 300; 38 KB
-
 US Solar Generation-2016.svg 800 × 300; 38 KB
-
 US Solar Generation-2017.svg 800 × 300; 38 KB
-
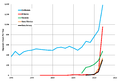
 US Solar Generation.png 1,300 × 400; 26 KB
-
 US Solar Generation.svg 800 × 300; 38 KB


.png)


.png)


.png)
.png)
.png)
.png)


