Category:Solar energy statistics
Jump to navigation
Jump to search
Subcategories
This category has the following 2 subcategories, out of 2 total.
P
Media in category "Solar energy statistics"
The following 59 files are in this category, out of 59 total.
-

-
 2010- Cost of renewable energy - IRENA.svg 1,000 × 750; 8 KB
-
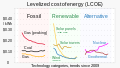 20201019 Levelized Cost of Energy (LCOE, Lazard) - renewable energy.svg 1,200 × 675; 4 KB
-
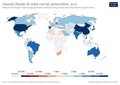 Annual-change-solar (OWID 0056).png 850 × 600; 104 KB
-
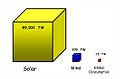 Available Energy-2.jpg 1,067 × 702; 84 KB
-
 Available Energy-3-es.png 1,067 × 702; 45 KB
-
 Available Energy-3.png 1,067 × 702; 50 KB
-
 Available Energy-3.svg 512 × 219; 22 KB
-
 Available Energy-4.png 1,067 × 702; 47 KB
-
 Available Energy-4.svg 541 × 856; 26 KB
-
 Available Energy-pl.svg 541 × 856; 26 KB
-
 Average monthly Insolation to 15 deg N S.jpg 1,226 × 788; 151 KB
-
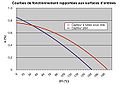 CourbesR CSTh SE.jpg 1,234 × 873; 121 KB
-
 CourbesR CSTh SHT.jpg 1,193 × 905; 121 KB
-
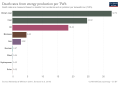 Death rates from energy production per TWh (including solar).svg 850 × 600; 27 KB
-

-
 Grid parity map.svg 940 × 470; 2.03 MB
-
 Growth of Wind and Solar to 92% by 2030.png 640 × 480; 23 KB
-
 Horas solares pico.png 711 × 380; 5 KB
-
-
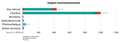
 Installed solar energy capacity, OWID.svg 850 × 600; 141 KB
-
 Installed solar PV capacity log graph.svg 850 × 600; 43 KB
-
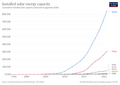 Installed-solar-PV-capacity (OWID 0605).png 850 × 600; 56 KB
-
 Italy wind solar prodution 2007-2014.svg 514 × 354; 20 KB
-
 Power of solar energy by country.jpg 660 × 768; 56 KB
-
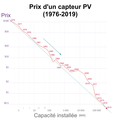 Prix d'un capteur photovoltaïque (1976-2019).png 2,000 × 2,100; 240 KB
-
 Share-electricity-solar.png 3,400 × 2,400; 707 KB
-
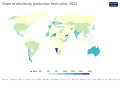 Share-electricity-solar.svg 850 × 600; 163 KB
-
 Solar energy generation by region OWID cs.svg 850 × 600; 54 KB
-
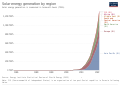 Solar energy generation by region, OWID.svg 850 × 600; 43 KB
-
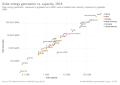 Solar energy generation vs. capacity, OWID.svg 850 × 600; 15 KB
-
 Solar energy generation, OWID.svg 850 × 600; 141 KB
-
 Solar energy generation.svg 850 × 600; 69 KB
-
 Solar Power Generation.jpg 845 × 590; 41 KB
-
 Solar PV Cumulative Capacity, OWID.svg 850 × 600; 6 KB
-
 Solar PV module prices vs. cumulative capacity, OWID.svg 850 × 600; 11 KB
-
 Solar PV module prices, OWID.svg 850 × 600; 6 KB
-
 Solar PV module prices.jpg 839 × 581; 32 KB
-
 Solar PV module prices.svg 850 × 600; 29 KB
-
 Solar PV system costs, OWID.svg 850 × 600; 7 KB
-
 Solar-electricity-per-capita (OWID 0968).png 850 × 600; 97 KB
-
 Solar-energy-consumption (OWID 1090).png 850 × 600; 104 KB
-
 Solar-energy-history.svg 390 × 330; 37 KB
-
 Solar-pv-prices-vs-cumulative-capacity.png 1,998 × 2,058; 290 KB
-
 Solar-share-energy-2019.svg 850 × 600; 168 KB
-
 Solar-share-energy.svg 850 × 600; 154 KB
-
 SolarGlobal2007V2.png 380 × 395; 56 KB
-
 Solarstromverbrauch brutto Deutschland.png 723 × 305; 6 KB
-
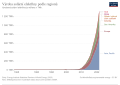
 Weltweite Solar- und Windenergie installierte Leistung.jpg 1,607 × 1,025; 226 KB
-
 WikiFig1.jpg 697 × 534; 48 KB
-
 Wind and Solar Average Capacity Growth Rate.png 640 × 480; 18 KB
-
 Wind and Solar Capacity Annual Growth Rate.png 800 × 600; 22 KB
-
 Wind-and-solar-2011.png 1,024 × 600; 26 KB
-
 Wind-and-solar.png 1,024 × 768; 39 KB
-
 Windandsolar.png 640 × 480; 22 KB
-
 World GHI Solar-resource-map GlobalSolarAtlas World-Bank-Esmap-Solargis.png 1,889 × 1,122; 1.51 MB
-
 World Wind and Solar Generation Percentage-BP-semilog.svg 800 × 600; 13 KB
-
 World Wind and Solar Generation Percentage-semilog.svg 800 × 600; 13 KB
-
 World-solar-wind-installed-capacity-2012.jpg 1,721 × 1,083; 255 KB


_-_renewable_energy.svg)
.png)


.svg)


.png)


.png)


.png)
.png)


