Category:Energy statistics of the United States
Jump to navigation
Jump to search
Countries of the Americas: Canada · United States of America
Main category: Energy statistics
Subcategories
This category has the following 5 subcategories, out of 5 total.
Media in category "Energy statistics of the United States"
The following 174 files are in this category, out of 174 total.
-

-
 10 yr Profile of Consumption by Category.png 530 × 445; 23 KB
-
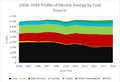
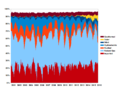
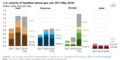
 2004-2014 Electric Energy ( B kWh) by Fuel Source.png 722 × 434; 64 KB
-
 2004-2014 Profile of Electric Energy by Fuel Source.png 670 × 460; 17 KB
-
 2011staterenewableelectricalgeneration.png 481 × 661; 8 KB
-
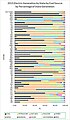
 2014 Electric Generation by State and by Fuel Source.png 562 × 651; 18 KB
-
-
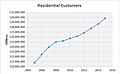 2015 Residential Customers.jpg 476 × 296; 33 KB
-
 2017 Electric Energy Consumption Profile.jpg 484 × 289; 39 KB
-
 2018 Electric Energy Consumption Profile 2018.jpg 545 × 407; 49 KB
-
 2018 Electric Generation by Source.jpg 483 × 732; 133 KB
-
 2018 Electric Generation by State.jpg 483 × 722; 59 KB
-
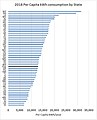 2018 Per Capita kWh Consumption by State.jpg 483 × 597; 66 KB
-
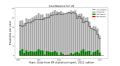
 2018 State Residential Electricity Costs per kWh.jpg 483 × 596; 62 KB
-
 2018 Top Ten States Coal.jpg 483 × 304; 30 KB
-
 2018 Top Ten States Gas.jpg 483 × 330; 37 KB
-
 2018 Top Ten States Nuclear.jpg 483 × 308; 32 KB
-
 2018 Top Ten States Petroleum.jpg 483 × 310; 26 KB
-

-
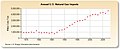 Annual US Natural Gas Imports 1973-2007.jpg 675 × 275; 26 KB
-
-
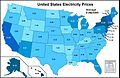
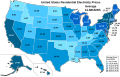
 Average Residential Price of Electricity by State.svg 990 × 627; 304 KB
-
 Average Retail Price of Electricity by State.jpg 1,513 × 983; 313 KB
-
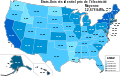 Average US Residential Price of Electricity by State fr.svg 990 × 627; 305 KB
-
 Average US Residential Price of Electricity by State-2012.svg 990 × 627; 298 KB
-
 California Electricity Percentage.png 1,024 × 768; 30 KB
-
 California Electricity Source.png 1,024 × 768; 43 KB
-
 CO2&NPPs.png 808 × 629; 187 KB
-
 Coal Balance US.svg 990 × 540; 60 KB
-
 Conso énergie secteur États-Unis.jpg 416 × 284; 25 KB
-
 Electric Energy Consumption by User Community.jpg 482 × 334; 48 KB
-
 Electricity use kwh per customer 2000-05.PNG 340 × 225; 5 KB
-
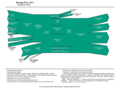
 Energy flow US 2016.jpg 1,920 × 1,115; 811 KB
-
 Energy Flow US 2016.png 3,249 × 1,887; 510 KB
-
 Energy Flow US 2017.png 4,873 × 2,831; 557 KB
-
 Energy Flow US 2019.png 3,249 × 1,911; 525 KB
-
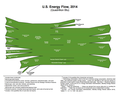
 Energy US 2014.png 3,000 × 2,000; 260 KB
-
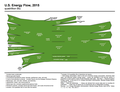
 Energy US 2015.png 3,232 × 1,889; 357 KB
-
 EROI - Ratio of Energy Returned on Energy Invested - USA.svg 578 × 434; 12 KB
-
 Estimated Effect of Carbon Tax in US.png 1,322 × 888; 30 KB
-
 Expected Energy Generation 2014-2019.png 481 × 329; 10 KB
-
 Expected Energy Output 2015-2019.png 481 × 354; 14 KB
-
 Figure 1 Life-Cycle of US Petroleum Imports.jpg 1,237 × 476; 94 KB
-
 Figure 4 Petroleum Domestic Production, Imports and Consumption.jpg 866 × 390; 67 KB
-
 Figure 7 Predicted Life-Cycle of Petroleum.jpg 564 × 208; 30 KB
-
 Future Oil Imports.png 1,059 × 575; 84 KB
-
 Gas Balance US.svg 990 × 540; 70 KB
-
 Gas Prices Short Term.png 1,024 × 768; 22 KB
-
 Graph 2.x600y480.jpg 600 × 384; 51 KB
-

-
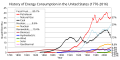 History of energy consumption in the United States.svg 800 × 400; 35 KB
-
 Imported Crude Oil as a Percent of US Consumption 1950-2003.jpg 850 × 617; 155 KB
-
 LLNL US Energy Flow 2009.png 3,000 × 2,000; 489 KB
-
 LLNLUSEnergy2010.png 3,000 × 2,000; 399 KB
-
 LLNLUSEnergy2011.png 3,000 × 2,000; 256 KB
-
 LLNLUSEnergy2012.png 3,000 × 2,000; 254 KB
-
 LLNLUSEnergy2013.png 3,000 × 2,000; 133 KB
-
-
 Monthly Profile US Renewables 2015.png 507 × 338; 12 KB
-

-
 Monthly US Coal Profile 2015.png 507 × 338; 12 KB
-
 Monthly US Natural Gas Profile 2015.png 507 × 338; 11 KB
-
 Monthly US Nuclear Profile 2015.png 507 × 338; 12 KB
-
 Monthly US Petrolum Profile 2015.png 507 × 338; 9 KB
-
-

-

-
 Oil Balance US.svg 990 × 540; 76 KB
-

-

-

-
 Profile 2004-2014 of Residential Average Cost per kWh.png 670 × 460; 18 KB
-
 Profile of Electric Consumption 2014.png 481 × 289; 10 KB
-
 Residential Average Cost per kWh 2004-2014.png 738 × 431; 61 KB
-
 Residential-Energy-consumption.png 1,221 × 909; 114 KB
-
 Retail Customers.png 521 × 397; 13 KB
-

-
 STATES in 2015 who EXPORTED Electric Energy.jpg 497 × 506; 46 KB
-
 States in 2015 who had to IMPORT Eectric Energy.jpg 480 × 492; 52 KB
-
 Tenyearhydrofacts.gif 528 × 309; 10 KB
-
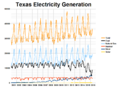 Texas Electricity Generation.png 1,024 × 768; 40 KB
-
 Texas Electricity Percentage.png 1,024 × 768; 38 KB
-
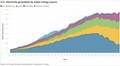 Timeline of U.S. electricity generation by major energy source.png 2,494 × 1,365; 160 KB
-
 Timing of state subsidies for nuclear power (48858457468).png 743 × 365; 20 KB
-
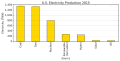
 U.S. 2013 Electricity Generation By Type crop.png 823 × 584; 55 KB
-

-
-

-

-
 U.S. Domestic Oil Production (6961921691).jpg 1,066 × 753; 168 KB
-

-
 U.S. Electricity Production 2015.svg 714 × 361; 45 KB
-
-

-
 U.S. motor gasoline product supplied (49784554532).png 828 × 428; 48 KB
-
 U.S. Net Electricity Generation 2001.svg 403 × 480; 81 KB
-
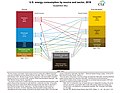
 U.S. primary energy consumption by source and sector, 2017.png 2,114 × 1,476; 543 KB
-
 U.S. primary energy consumption by source and sector, 2018.jpg 6,600 × 5,100; 3.51 MB
-

-
 U.S. utility-scale battery storage capacity as of November 2023.svg 609 × 281; 31 KB
-
 United States electricity generation by fuel 1990-2040.png 640 × 540; 38 KB
-
 United States electricity generation by fuel 2000-2040.png 840 × 720; 67 KB
-
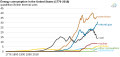
 United States Energy Consumption by Source 2000-2011.png 1,024 × 768; 38 KB
-
 United States Energy Consumption by Source 2000-2013.png 1,024 × 768; 24 KB
-
 United States per capita energy use 1650-2010.png 1,024 × 768; 34 KB
-
 United States primary energy consumption 1980-2040.png 900 × 800; 58 KB
-
 US Average Cost of Delivered Fossil Fuel.svg 750 × 560; 21 KB
-
 US EIA monthly capacity factors 2011-2013.png 575 × 287; 44 KB
-
 US Electric Energy Consumption by Consumer Communities.gif 579 × 195; 6 KB
-
 US electricity generation by source.svg 800 × 600; 23 KB
-
 US electricity prod from coal 1995 2006.gif 587 × 501; 12 KB
-
 US Electricity Source 2016.svg 425 × 473; 99 KB
-
 US energy consumption 1650-1900 semilog.png 1,024 × 768; 45 KB
-
 US energy consumption 1650-1900.png 1,024 × 768; 48 KB
-
 US energy consumption 2010-2050.png 800 × 600; 35 KB
-
 US energy consumption 2035-EIA Reference Case.png 640 × 480; 20 KB
-
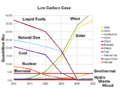 US energy consumption 2035-Low Carbon Case.png 640 × 480; 29 KB
-
 US energy consumption 2035-Reference Case.png 640 × 480; 31 KB
-
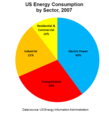 US Energy Consumption by Sector 2007.PNG 704 × 772; 30 KB
-
 US Energy Consumption by Sector.png 1,024 × 932; 31 KB
-
 US energy consumption by sector.svg 800 × 600; 15 KB
-
 US Energy Consumption by Source 1635-2006.png 1,065 × 328; 29 KB
-
 US energy consumption by source 1800-2010 semilog.png 1,024 × 768; 65 KB
-
 US Energy Consumption by Source 2007.PNG 780 × 793; 38 KB
-
 US energy consumption by source 2011.png 1,024 × 768; 32 KB
-
 US energy consumption by source 2012.png 1,024 × 768; 24 KB
-
 US Energy Consumption by Source 2013.png 1,024 × 768; 22 KB
-
 US energy consumption by source semilog.png 1,024 × 768; 52 KB
-
 US Energy Consumption by Source.png 1,024 × 768; 27 KB
-
 US energy consumption.png 1,024 × 768; 36 KB
-
 US energy consumption.svg 864 × 480; 96 KB
-
 US energy flow 2009.png 1,310 × 990; 392 KB
-
 US Energy Flow 2010.png 1,160 × 870; 393 KB
-
 US energy flow 2011.png 1,170 × 890; 383 KB
-
 US energy flow 2012.png 1,366 × 1,063; 472 KB
-
 US energy flow 2013.png 1,090 × 820; 382 KB
-
 US energy flow 2014.png 1,240 × 1,000; 426 KB
-
 US energy flow 2015.png 1,260 × 970; 473 KB
-
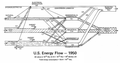 US Energy Flow-1950.png 1,150 × 600; 322 KB
-
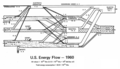 US Energy Flow-1960.png 1,130 × 650; 380 KB
-
 US Energy Flow-1970.png 1,130 × 620; 394 KB
-
 US Energy Flow-1980 (1973 projection).png 1,000 × 630; 372 KB
-
 US Energy Flow-1990 (1973 projection).png 923 × 683; 371 KB
-
 US Energy Flow-1990.png 900 × 718; 105 KB
-
 US Energy Flow-2010.png 1,024 × 768; 105 KB
-
 US Energy Flow-2020.png 1,024 × 768; 104 KB
-
 US Energy Flow-2030.png 1,024 × 768; 103 KB
-
 US Energy Flow-2040.png 1,024 × 768; 101 KB
-
 US Energy Flow-2050.png 1,024 × 768; 102 KB
-
 US gas production.jpg 675 × 275; 28 KB
-
 US historical energy consumption 1776-2018.png 1,280 × 601; 116 KB
-
 US historical energy consumption 1776-2018.svg 588 × 276; 47 KB
-
 US historical energy consumption.PNG 322 × 197; 9 KB
-
 US historical energy consumption.png 583 × 290; 29 KB
-
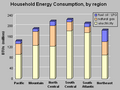 US household energy usage.png 413 × 310; 10 KB
-
 US Natural Gas Production 1990-2040.jpg 866 × 594; 131 KB
-
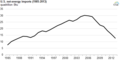 US Net Energy Imports.png 575 × 287; 15 KB
-
 US Net Gas Imports.png 1,950 × 1,450; 31 KB
-
 US Net Gas Imports.svg 926 × 689; 43 KB
-
 US Nuclear Electricity 1957-2019.png 912 × 608; 36 KB
-
 US oil imports by country.jpeg 585 × 289; 77 KB
-
 US Percent of Energy Exported-Projected-2050.png 1,600 × 400; 43 KB
-
 US Primary Energy Consumption by Source and Sector 2013.png 1,033 × 742; 387 KB
-
 US primary energy consumption by source.svg 800 × 600; 15 KB
-
 US renewable electricity generation AEO Reference case 2000-2040.png 900 × 800; 46 KB
-
 US Total Energy 1949-2011.png 800 × 600; 34 KB
-
 US Total Primary Energy Consumption in 2015.svg 1,317 × 737; 465 KB
-
 US Uranium Imports 2012.png 574 × 288; 61 KB
-
 USA 2014 Electric Energy Export or Import by State.png 481 × 782; 20 KB
-
 USEnergyFlow08-quads.png 3,000 × 2,000; 469 KB
-
 USEnFlow02-quads.gif 700 × 560; 48 KB
-
 Utilis tot énergie primaire États-Unis.jpg 416 × 284; 24 KB
-
 Utilis énergie habitant États-Unis.jpg 416 × 284; 26 KB
-

_feedgas_at_selected_export_terminals_in_June_1_through_October_6,_2020_(50435838458).png)

_by_Fuel_Source.png)


.png)


_(44530715841).png)


.png)

_(45664259591).png)


.png)
.png)

_(31508572458).png)
_(45333189252).png)
_(43566833470).png)


.png)


_(cropped).png)
.png)
.png)
_(31791566138).png)
.jpg)
_(43797645490).png)

_in_January_2017_through_May_2019_(48403827021).png)
.png)
.png)


_(44637262144).png)


.png)
.png)


.png)
.png)