Category:RCraig09 charts showing data through 2022
Jump to navigation
Jump to search
English: Charts uploaded by User:RCraig09 showing data through 2022—used for tracking which charts may be due for updating.
Media in category "RCraig09 charts showing data through 2022"
The following 38 files are in this category, out of 38 total.
-
 1850- Annual emissions of carbon dioxide, by country.svg 1,200 × 675; 20 KB
-
 1850- Cumulative emissions of carbon dioxide, by country.svg 1,200 × 675; 17 KB
-
 1851- U.S. landfall hurricanes by month.svg 900 × 600; 1 KB
-
 1851-2017 Atlantic hurricanes and tropical storms by month.svg 1,000 × 750; 3 KB
-

-
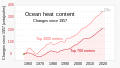 1955- Ocean heat content - NOAA.svg 1,200 × 675; 6 KB
-
 1960- Groundwater loss - depletion - Central Valley of California.svg 1,200 × 675; 4 KB
-
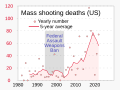
 1970- Gun production - US.svg 1,000 × 750; 3 KB
-
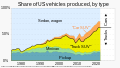 1975- US vehicle production share, by vehicle type.svg 1,200 × 675; 4 KB
-
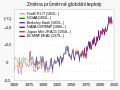
 1979- Radiative forcing - climate change - global warming - EPA NOAA.svg 1,100 × 750; 15 KB
-
-
 1988- Deforestation rates in Brazil - Terra Brasilis.svg 1,250 × 675; 3 KB
-
 1990- Renewable energy production, by source cs.svg 1,000 × 750; 5 KB
-
 1990- Renewable energy production, by source.svg 1,000 × 750; 5 KB
-
 1994- Motor vehicle traffic deaths in road accidents, by country.svg 1,000 × 750; 6 KB
-
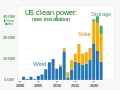 2000- Clean power installation - wind, solar, storage - US.svg 1,000 × 750; 3 KB
-
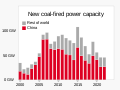 2000- New coal-fired power capacity - Global Energy Monitor.svg 1,000 × 750; 4 KB
-
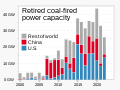 2000- Retired coal-fired power capacity - Global Energy Monitor.svg 1,000 × 750; 6 KB
-
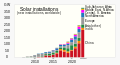 2007- New solar installations - annually by country or region.svg 1,250 × 675; 6 KB
-
 2007- Profits of energy companies (annual) - stacked bar chart.svg 1,200 × 675; 6 KB
-

-
 2008- Oil and gas industry global net income - IEA.svg 1,200 × 675; 3 KB
-

-
 2010- Cost of renewable energy - IRENA.svg 1,000 × 750; 8 KB
-
 2010- Decreasing renewable energy costs versus deployment.svg 1,000 × 750; 5 KB
-
 2010- Fossil fuels vs Wind + Solar - electricity generation.svg 859 × 750; 8 KB
-

-
 2011- Renewable energy capacity - International Energy Agency.svg 1,200 × 675; 4 KB
-
 2017- Top earners on YouTube - column chart.svg 1,200 × 675; 2 KB
-

-
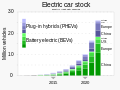 2020+ Electric vehicle stock - International Energy Agency.svg 1,000 × 750; 6 KB
-
 20200107 "Global warming" vs "Climate change" Google search term ratio.png 2,215 × 1,674; 98 KB
-
-
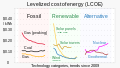 20201019 Levelized Cost of Energy (LCOE, Lazard) - renewable energy.svg 1,200 × 675; 4 KB
-
 20201210 Antarctica ice mass variation - NASA GRACE-en.svg 1,000 × 750; 5 KB
-
 20210119 Renewable energy investment - 2004- BloombergNEF.svg 1,200 × 675; 6 KB
-
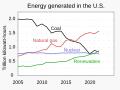 20221231 Energy generation in the United States - Rhodium Group.svg 1,000 × 750; 3 KB
-


_-_stacked_bar_chart.svg)


_-_renewable_energy.svg)


