Category:RCraig09 charts showing data through 2021
Jump to navigation
Jump to search
English: Charts uploaded by User:RCraig09 showing data through 2021—used for tracking which charts may be due for updating.
Media in category "RCraig09 charts showing data through 2021"
The following 20 files are in this category, out of 20 total.
-
 1776 Historical energy consumption - U.S. - EIA data.svg 1,200 × 675; 6 KB
-
 1800- Global carbon dioxide emissions, per person.svg 1,200 × 675; 6 KB
-
 1880- Global average sea level rise (SLR) - annually.svg 1,200 × 675; 6 KB
-
 1895- Temperature change in the United States - Ed Hawkins - climate change.jpg 4,536 × 2,551; 267 KB
-
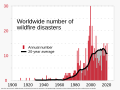 1911- Wildfire disasters - worldwide.svg 1,000 × 750; 5 KB
-
 1953- Funding for research and development - US.svg 1,000 × 750; 6 KB
-

-

-

-

-
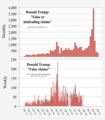 2017- Donald Trump - graph - false or misleading claims.png 2,332 × 2,657; 597 KB
-
 2017- Donald Trump veracity - composite graph.png 2,775 × 1,750; 141 KB
-
 20190731 Central England Temperature (CET) (annual mean, beginning in 1659).png 3,323 × 1,351; 136 KB
-
 2021 Household wealth by percentile - United States.svg 1,000 × 750; 2 KB
-
 2021 Median household wealth, by highest educational attainment - US.svg 1,000 × 750; 2 KB
-
 2021 Median wealth by marital status - US.svg 1,000 × 750; 2 KB
-

-

-
 20220314 Renewable electricity generation - United States.svg 1,075 × 750; 7 KB
-
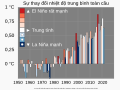 Global surface temperature bar chart-vi.svg 1,000 × 750; 8 KB


_-_annually.svg)


_-_bar_chart.svg)


_(annual_mean,_beginning_in_1659).png)