Category:Maps of weather and climate effects
Jump to navigation
Jump to search
Maps of “effects” means meteorological theory of phenomena, for synoptical analysis of specific times see Category:Maps of weather forecast and climate prediction
Subcategories
This category has the following 6 subcategories, out of 6 total.
Media in category "Maps of weather and climate effects"
The following 23 files are in this category, out of 23 total.
-
 Klima kipp punkte.png 500 × 300; 125 KB
-
 Arctic Oscillation.png 2,102 × 4,424; 2.86 MB
-
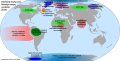
 Climate-tipping-points-de.svg 2,479 × 1,409; 420 KB
-
 Climate-tipping-points-en.svg 2,479 × 1,409; 420 KB
-
 Climate-tipping-points-es.svg 2,479 × 1,409; 440 KB
-
 Climate-tipping-points-fr.svg 2,760 × 1,398; 274 KB
-
 Climate-tipping-points-interactions-de.svg 2,030 × 1,398; 373 KB
-
 Climate-tipping-points-interactions-no.svg 2,030 × 1,398; 347 KB
-
 Climate-tipping-points-interactions-pl.svg 2,030 × 1,398; 347 KB
-
 Climate-tipping-points-pl.svg 2,760 × 1,398; 293 KB
-
 Jetstream - Rossby Waves - N hemisphere.svg 1,042 × 253; 7 KB
-
 Marine Layer Deep or Shallow Graphic (NWS Los Angeles-Oxnard).jpg 852 × 706; 134 KB
-
 MODIS temperature map.jpg 720 × 398; 53 KB
-
 N Jetstream Rossby Waves N.gif 1,042 × 253; 20 KB
-
 Sunniest Place On Earth September 2017 (36766170073).jpg 3,333 × 1,861; 1.56 MB
-

-
-
-

-

-

-
-
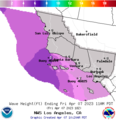 Wave height map created by National Weather Service Los Angeles.png 420 × 433; 11 KB


.jpg)

.jpg)
-Predicting-Future-Trends-pone.0047981.g001.jpg)
-Predicting-Future-Trends-pone.0047981.g002.jpg)
-Predicting-Future-Trends-pone.0047981.g005.jpg)
-Predicting-Future-Trends-pone.0047981.g007.jpg)

-Predicting-Future-Trends-pone.0047981.g003.jpg)
-Predicting-Future-Trends-pone.0047981.g004.jpg)
-Predicting-Future-Trends-pone.0047981.g006.jpg)