Category:Centers of action (Meteorology)
Appearance
This is for meteorological theory of weather and climate effects, for specific events see Category:High pressure systems and Category:Low pressure systems
| Upload media | |||||
| Subclass of | |||||
|---|---|---|---|---|---|
| Part of | |||||
| Discoverer or inventor | |||||
| |||||
Subcategories
This category has the following 9 subcategories, out of 9 total.
A
- Azores High (16 F)
B
- Block (meteorology) (11 F)
C
- Cold air damming (7 F)
F
- Fujiwhara effect (34 F)
N
- North Pacific High (4 F)
Media in category "Centers of action (Meteorology)"
The following 37 files are in this category, out of 37 total.
-
Bermudahoch Hurrikan.jpg 2,481 × 1,634; 882 KB
-
Carte mondiale de la distribution des pressions et des vents.png 1,212 × 797; 1.63 MB
-
Centros de acción sobre España.png 640 × 514; 8 KB
-
Centros de acción sobre España.svg 640 × 514; 442 KB
-
Ciclone1.jpg 224 × 224; 33 KB
-
Circulation Northeaster.png 522 × 644; 44 KB
-
Clima de Chile fr.png 384 × 404; 96 KB
-
Clima de Chile.JPG 384 × 404; 30 KB
-
Colorado low circulation.png 1,280 × 1,024; 169 KB
-
Cpc-ncep-noaa z200anim 07JUN2012-06JUL2012.gif 538 × 305; 2.27 MB
-
Diagrama climático de Chile.svg 1,418 × 1,284; 130 KB
-
East asian baiu-front and air masses.png 1,200 × 800; 86 KB
-
Etisiai.jpg 850 × 680; 170 KB
-
ExampleWeatherMapWesternEurope.jpg 800 × 735; 57 KB
-
Hann Atlas der Meteorologie 10.jpg 1,180 × 962; 363 KB
-
Isobaren bei Orkan.svg 1,024 × 678; 742 KB
-
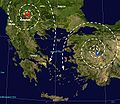
Meltemi.jpg 723 × 624; 65 KB
-
Mistral wind1.jpg 455 × 432; 51 KB
-
Mjo north america rain.png 556 × 749; 28 KB
-
MN weatherpatterns.svg 770 × 800; 310 KB
-
Monsoonmapb.JPG 669 × 581; 49 KB
-
Mslp-jja-djf.png 652 × 674; 24 KB
-
NA monsoon map.gif 1,338 × 1,162; 98 KB
-
Omegalage Russland Pakistan 2010.svg 941 × 415; 1.2 MB
-
Pression moyenne niveau de la mer djf.png 641 × 352; 23 KB
-
Pression moyenne niveau de la mer jja (cropped).png 194 × 145; 2 KB
-
Pression moyenne niveau de la mer jja.png 641 × 352; 24 KB
-
PSM V16 D306 Weather map western hemisphere 130 to 50 longitude.jpg 1,029 × 627; 106 KB
-
PSM V16 D306 World weather map jan 25 1878.jpg 1,096 × 1,274; 272 KB
-
PSM V16 D456 Weather map eastern hemisphere 50 to 130 longitude.jpg 1,024 × 553; 105 KB
-
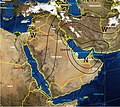
Shamal1 en.jpg 819 × 730; 218 KB
-
Shamal2 pl.jpg 819 × 730; 214 KB
-
Sirocco wind1.jpg 713 × 500; 41 KB
-
Sistema frontal.jpg 450 × 215; 52 KB
-
Subtropridgejulyna.gif 625 × 445; 12 KB
-
July mean flow at 18000 feet.png 625 × 445; 9 KB
-
Winterpatterns.gif 505 × 631; 13 KB


