Category:Economic charts of the Republic of Ireland
Jump to navigation
Jump to search
Media in category "Economic charts of the Republic of Ireland"
The following 47 files are in this category, out of 47 total.
-
 2011 Ratio of GNI to GDP (EuroStat National Accounts).png 300 × 480; 58 KB
-
 At-risk-of-poverty rate ireland 1995-2016.svg 512 × 293; 12 KB
-
 Average tax wedge for single worker (OECD vs Ireland, 2000 to 2017).png 1,284 × 413; 46 KB
-
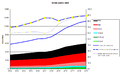
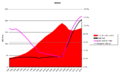
 BruttostaatsschuldenEuro.png 958 × 593; 29 KB
-
 BruttostaatsschuldenEuroEngl.png 958 × 593; 30 KB
-
 Celtictiger 1.gif 495 × 345; 18 KB
-
 Disposable Income Per Person 2018 (Ireland).png 1,495 × 1,104; 245 KB
-
 Distribution of Irish Exchequer Tax (2000 to 2017).png 872 × 540; 37 KB
-
 Distribution of Wealth in Ireland.svg 800 × 600; 24 KB
-
 Dublin Office cost of build versus EU-28 (2016).jpg 638 × 479; 59 KB
-
 Dublin Office sales price versus EU-28 (2016).jpg 638 × 479; 65 KB
-

-
 Effective employment tax (Ireland vs OECD average, 2017).png 1,452 × 425; 112 KB
-
-

-
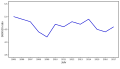
 Gini index ireland 1995-2016.svg 512 × 293; 12 KB
-
 Impact of Ireland Corporation Tax Regime on Ireland's Economy.jpg 742 × 563; 61 KB
-

-
 Income percentiles ireland - relative change - 1995-2016.svg 512 × 293; 15 KB
-
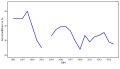
 Interest rates Ireland 1993-2018.svg 475 × 332; 11 KB
-
 Ireland Balance of Payment Components (2012-2017).png 680 × 490; 217 KB
-
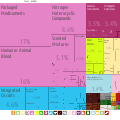
 Ireland Export Treemap.jpg 2,668 × 2,085; 1.91 MB
-
 Ireland Exports Treemap 2017.svg 900 × 900; 508 KB
-
 Ireland GDP per capita.png 663 × 334; 15 KB
-
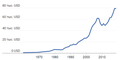
 Ireland GDP.webp 1,588 × 388; 31 KB
-
 Ireland house prices.png 970 × 604; 19 KB
-
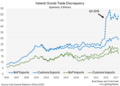 Ireland Trade Good Discrepancy (1995-2017).png 680 × 489; 326 KB
-
 Irish Corporation Tax (% of GDP and % of Total Tax).png 588 × 517; 27 KB
-
 Irish Corporation Tax as % of Total Irish Tax (1989 to 2012).pdf 1,239 × 1,752; 1.26 MB
-
 Irish Corporation Tax as % of Total Tax (1989 to 2012).jpg 1,843 × 1,303; 244 KB
-
 Irish Corporation Tax Rates (1974 to 2016).png 600 × 499; 42 KB
-
 Irish debt and EU average.png 704 × 681; 51 KB
-
 Irish Debt to GDP and GNI (2000 to 2017).png 852 × 536; 25 KB
-
 Irish Exchequer Tax Revenues to GDP and GNI.png 864 × 491; 24 KB
-
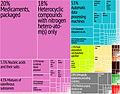
 Irish Exports 2014.svg 750 × 520; 50 KB
-
 Irish GDPDebt Ratio Chart.jpg 500 × 360; 56 KB
-
 Irish house prices Central Statistics Office.png 970 × 604; 19 KB
-
 Irish Personal Tax System - OECD Progressivity Ratio (2015).png 960 × 521; 110 KB
-
 Irishcorporatetaxrate.PNG 469 × 401; 24 KB
-
 IrlSchuKrise.png 960 × 594; 37 KB
-
 IrlSchuKriseEngl-ar.png 960 × 594; 58 KB
-
 IrlSchuKriseEngl.png 960 × 594; 36 KB
-
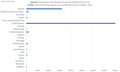
 OECD 2018 Corporate Tax Rates.png 607 × 764; 47 KB
-
 OECD Public Debt per Capita (2015).png 848 × 372; 27 KB
-
 S80s20 ireland 2005-2016.svg 512 × 293; 11 KB
-
 Tax-to-GDP Ratio (Ireand versus OECD, 2000-2016).png 1,448 × 541; 54 KB
-
 ديون ايرلندا منذ 1999.jpg 704 × 681; 74 KB
.png)


.png)
.png)

.jpg)
.jpg)
.jpg)


.png)


.png)
.png)
.jpg)
.png)

.png)


.png)


.png)


.png)
.png)
.png)