Category:Economic charts of Germany
Jump to navigation
Jump to search
Subcategories
This category has the following 5 subcategories, out of 5 total.
Media in category "Economic charts of Germany"
The following 48 files are in this category, out of 48 total.
-
 (1953-2023) Employees by industries of Germany.svg 1,151 × 712; 400 KB
-
 Arbeitnehmereinkommen.pdf 1,752 × 1,239; 177 KB
-
 Befristet beschäftigte Wissenschaftler 2014.png 750 × 449; 17 KB
-
 Benzinpreis ch.png 1,931 × 935; 420 KB
-
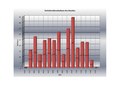
 Betriebsprüfungen Mehreinnahmen Anzahl.jpg 592 × 696; 106 KB
-
 BIP und Arbeitslosenquote DE-ST ab 1990.svg 1,212 × 832; 51 KB
-
 Bruttoinlandsprodukt Deutschland - Verwendung 2013.svg 832 × 496; 31 KB
-
 Bruttonationaleinkommen.pdf 1,752 × 1,239; 194 KB
-
 Chart Herkunft ausländischer Patienten in Deutschland.jpg 909 × 583; 251 KB
-
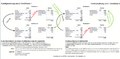
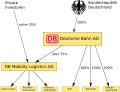 DBAG Teilprivatisierung Holdingmodell.svg 698 × 533; 34 KB
-
 Distribution of Wealth in Germany.svg 800 × 600; 24 KB
-
 DMAX market share 2006 to 2014 (de).svg 774 × 517; 67 KB
-
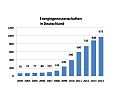 EnergieGenossenschaften2011.jpg 960 × 720; 47 KB
-
 Entgelte Leiharbeit 2010.png 1,062 × 794; 222 KB
-
-
 Entwicklung der aerodynamische Institute in Göttingen.png 1,101 × 408; 39 KB
-
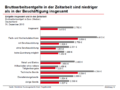
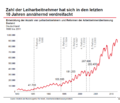 Entwicklung der Leiharbeit 1980-2010.png 950 × 813; 231 KB
-
 Entwicklung der nicht erwerbstätigen Mütter (D).png 1,202 × 638; 32 KB
-
 Entwicklung des Kaffeepreises.jpg 795 × 384; 35 KB
-
 Entwicklung Erwerbstätige Arbeitsvolumen Vollzeitäquivalente D.svg 985 × 733; 22 KB
-
 Entwicklung von Inbound-Investitionen.jpg 534 × 325; 29 KB
-
 Entwicklung von Outbound-Investitionen.jpg 535 × 324; 30 KB
-
 Erwerbstätige im Alter ab 65 Jahren.png 660 × 670; 38 KB
-
 Geldbasis Deutschlands.jpg 862 × 600; 113 KB
-
 Kreditgewaehrung im Gleichschritt (Gestrich 1936).png 1,439 × 703; 432 KB
-
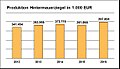 LRZ Produktion Hintermauerziegel 2016.jpg 613 × 350; 86 KB
-
 LRZ Produktion Hintermauerziegel 2016.svg 315 × 158; 605 KB
-
 LSt D Vorsorgepauschale 2022 nach Bruttoeinkommen.svg 1,170 × 900; 91 KB
-
 Marktanteil ProSieben 1990-2006.gif 2,865 × 1,765; 28 KB
-
 Marktanteil ProSieben 1990-2007.gif 3,122 × 2,078; 38 KB
-
 Marktanteil ProSieben 1990-2008.gif 3,200 × 2,129; 51 KB
-
 Marktanteil ProSieben.svg 672 × 606; 153 KB
-
 Marktanteil-sat1.png 2,977 × 1,789; 33 KB
-
 Marktanteil-sat1.svg 1,052 × 616; 44 KB
-
 Nettokreditaufnahme.pdf 1,752 × 1,239; 267 KB
-
 ProSieben MA 2014.svg 512 × 472; 19 KB
-
 Rentenniveauentwicklung.svg 938 × 703; 74 KB
-
 REX-Kursindex 2017-12-31.png 976 × 631; 15 KB
-
 REX-Performanceindex 2017-12-31.png 976 × 631; 11 KB
-
 RTL Marktanteile 1985-2009.svg 552 × 218; 33 KB
-
 RTL-Marktanteil.png 658 × 324; 9 KB
-
 RTL-Marktanteil2008.PNG 445 × 213; 6 KB
-
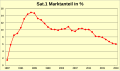
 Sat1 Marktanteile 1987-2010.png 960 × 550; 76 KB
-
 Sinus Milieus in Deutschland, Österreich und der Schweiz.png 862 × 517; 158 KB
-
 UBilanzzahlen.png 978 × 632; 63 KB
-
 Verteilung Bruttoeinkommen 2014 in Deutschland.svg 1,357 × 974; 51 KB
-
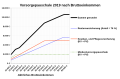 Vorsorgepauschale 2019 in Deutschland nach Bruttoeinkommen.svg 1,035 × 673; 40 KB
-
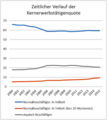 Zeitlicher Verlauf der Kernerwerbstätigenquote.png 600 × 671; 40 KB
_Employees_by_industries_of_Germany.svg)


.svg)


.png)


.png)


