Category:Economic charts of the United Kingdom
Jump to navigation
Jump to search
Subcategories
This category has the following 2 subcategories, out of 2 total.
Media in category "Economic charts of the United Kingdom"
The following 32 files are in this category, out of 32 total.
-

-

-
 Chattisham employment industry 2011.png 1,220 × 776; 493 KB
-
 Corporate insolvencies 2003-2012.png 664 × 519; 52 KB
-
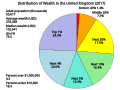 Distribution of Wealth in the United Kingdom.svg 800 × 600; 24 KB
-
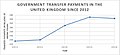 Government transfer payments in the UK since 2012.jpg 471 × 216; 24 KB
-
 Monthly Business Survey – Retail Sales Inquiry.png 1,149 × 928; 124 KB
-
 RentUSAGerFraBri.png 708 × 492; 9 KB
-

-
 Trade in goods and services balance (U.K.).png 1,768 × 847; 99 KB
-
 UK average unemployment rate by decade.png 567 × 379; 13 KB
-
 UK car vehicle excise duty 2013.svg 512 × 1,536; 6 KB
-
 UK cout operation relatif.svg 512 × 410; 13 KB
-
 UK GDP average growth rate by decade.jpg 568 × 379; 76 KB
-
 UK GDP year-on-year growth rates.png 1,332 × 919; 80 KB
-
 UK Gini coefficient 1961-2017.png 1,275 × 597; 63 KB
-
 UK indice solvabilite.svg 512 × 410; 12 KB
-
 UK interest rate since 1800.png 1,589 × 870; 69 KB
-
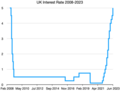 UK interest rates 2008-23.png 775 × 586; 32 KB
-
 UK oil and petroleum trade balance.png 721 × 433; 16 KB
-
 UK output per hour worked.png 1,280 × 757; 31 KB
-
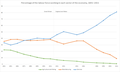 UK percentage of workforce by sector.png 961 × 577; 31 KB
-
 UK price inflation over 750 years.JPG 1,482 × 1,058; 95 KB
-
 UK profits and investment.png 594 × 293; 26 KB
-
 UK recession recoveries.png 1,056 × 635; 58 KB
-
 UK unemployment rate.png 1,451 × 864; 64 KB
-
 UK unemployment.png 552 × 402; 21 KB
-
 UK value of exports at constant prices since 1995.png 660 × 380; 65 KB
-
 UK vs US post-crisis GDP.png 480 × 291; 50 KB
-
 United Kingdom unemployment 1881-2017.png 650 × 336; 86 KB
-
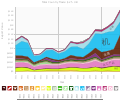
 产品泰国出口到联合王国 (1995 - 2012).svg 600 × 507; 102 KB
-
 产品联合王国出口到泰国 (1995 - 2012).svg 600 × 507; 104 KB


.png)


.svg)
.svg)