Category:Drug dose-response relationship
Jump to navigation
Jump to search
Subcategories
This category has only the following subcategory.
Media in category "Drug dose-response relationship"
The following 114 files are in this category, out of 114 total.
-
Agonist 2-ru.svg 801 × 506; 2 KB
-
Agonist 2.png 442 × 310; 10 KB
-
Agonist Antagonist.png 428 × 249; 15 KB
-
Agonist Antagonist.svg 800 × 460; 193 KB
-
Agonist full and partial.svg 840 × 437; 60 KB
-
Agonist v3.png 635 × 363; 29 KB
-
Agonist.png 180 × 126; 13 KB
-
Agonisti pieno e parziale.svg 840 × 437; 61 KB
-
-
-
Antagonismus.png 362 × 296; 8 KB
-
Antagonist.sr.png 1,238 × 1,121; 61 KB
-
Antagonistes competitius.png 488 × 329; 23 KB
-
Antagonistes no competitius.png 430 × 386; 25 KB
-
Anti-Angiogenic-and-Anti-Inflammatory-Properties-of-Kahweol-a-Coffee-Diterpene-pone.0023407.s001.ogv 5.2 s, 1,280 × 800; 1.75 MB
-
Anti-Angiogenic-and-Anti-Inflammatory-Properties-of-Kahweol-a-Coffee-Diterpene-pone.0023407.s002.ogv 6.1 s, 1,280 × 800; 2.13 MB
-
Atomic-Force-Mechanobiology-of-Pluripotent-Stem-Cell-Derived-Cardiomyocytes-pone.0037559.s002.ogv 5.1 s, 768 × 576; 654 KB
-
Atomic-Force-Mechanobiology-of-Pluripotent-Stem-Cell-Derived-Cardiomyocytes-pone.0037559.s003.ogv 4.9 s, 768 × 576; 1.18 MB
-
Automated-measurement-of-cell-motility-and-proliferation-1471-2121-6-19-S1.ogv 38 s, 320 × 240; 2.43 MB
-
Automated-measurement-of-cell-motility-and-proliferation-1471-2121-6-19-S2.ogv 1 min 19 s, 320 × 240; 687 KB
-
Automated-measurement-of-cell-motility-and-proliferation-1471-2121-6-19-S3.ogv 1 min 51 s, 720 × 480; 1.23 MB
-
Blockade-of-leukocyte-haptokinesis-and-haptotaxis-by-ketoprofen-diclofenac-and-SC-560-1471-2172-12-64-S1.ogv 6.5 s, 1,024 × 768; 15.67 MB
-
Blockade-of-leukocyte-haptokinesis-and-haptotaxis-by-ketoprofen-diclofenac-and-SC-560-1471-2172-12-64-S2.ogv 7.5 s, 1,024 × 768; 7.21 MB
-
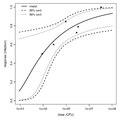
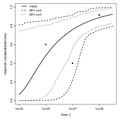
BPmodel106.pdf 1,050 × 1,050; 58 KB
-
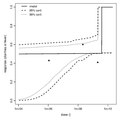
BPmodel138.pdf 1,050 × 1,050; 58 KB
-
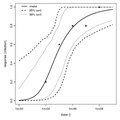
BPmodel185.pdf 1,050 × 1,050; 57 KB
-
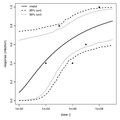
BPmodel186.pdf 1,050 × 1,050; 58 KB
-
BPmodel188.pdf 1,050 × 1,050; 57 KB
-
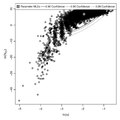
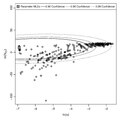
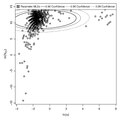
BPscatter106.pdf 1,050 × 1,050; 622 KB
-
BPscatter138.pdf 1,050 × 1,050; 614 KB
-
BPscatter185.pdf 1,050 × 1,050; 622 KB
-
BPscatter186.pdf 1,050 × 1,050; 622 KB
-
BPscatter188.pdf 1,050 × 1,050; 622 KB
-
-
-
-
-
-
-
-
-
Corva dosi-resposta agonista.jpg 421 × 223; 34 KB
-
-
-
-
-
Cucurbitacin-I-Inhibits-Cell-Motility-by-Indirectly-Interfering-with-Actin-Dynamics-pone.0014039.s006.ogv 21 s, 1,114 × 460; 13.17 MB
-
-
Dawka odpowiedź.JPG 493 × 446; 16 KB
-
Dose response antagonist.jpg 587 × 279; 60 KB
-
-
-
-
-
-
Dose-response curve1.jpg 800 × 588; 43 KB
-
DoseResponse.png 1,206 × 870; 77 KB
-
DoseResponse000.svg 320 × 193; 22 KB
-
-
-
-
-
-
Excessive-Nitrite-Affects-Zebrafish-Valvulogenesis-through-Yielding-Too-Much-NO-Signaling-pone.0092728.s008.ogv 9.8 s, 1,360 × 1,024; 723 KB
-
Excessive-Nitrite-Affects-Zebrafish-Valvulogenesis-through-Yielding-Too-Much-NO-Signaling-pone.0092728.s009.ogv 9.8 s, 1,360 × 1,024; 698 KB
-
-
Half life cross short to slow.svg 640 × 480; 6 KB
-
Half life steady state.svg 640 × 480; 6 KB
-
Half life withdrawal gradually reduce.svg 640 × 480; 6 KB
-
Half life withdrawal long to slow mistake.svg 640 × 480; 7 KB
-
Hormesis dose response graph-2.svg 660 × 435; 5 KB
-
Hormesis dose response graph.svg 660 × 435; 3 KB
-
Hsp90-Selectively-Modulates-Phenotype-in-Vertebrate-Development-pgen.0030043.sv001.ogv 20 s, 549 × 484; 513 KB
-
Hsp90-Selectively-Modulates-Phenotype-in-Vertebrate-Development-pgen.0030043.sv002.ogv 10 s, 350 × 357; 274 KB
-
Hsp90-Selectively-Modulates-Phenotype-in-Vertebrate-Development-pgen.0030043.sv003.ogv 10 s, 355 × 372; 454 KB
-
Hsp90-Selectively-Modulates-Phenotype-in-Vertebrate-Development-pgen.0030043.sv004.ogv 30 s, 389 × 391; 371 KB
-
Hsp90-Selectively-Modulates-Phenotype-in-Vertebrate-Development-pgen.0030043.sv005.ogv 20 s, 672 × 512; 626 KB
-
Hsp90-Selectively-Modulates-Phenotype-in-Vertebrate-Development-pgen.0030043.sv006.ogv 20 s, 672 × 512; 734 KB
-
-
-
-
-
-
-
Inverse agonist 2.png 2,244 × 1,172; 156 KB
-
Inverse agonist 3-ru.svg 723 × 355; 31 KB
-
Inverse agonist 3.svg 534 × 293; 67 KB
-
Inverse agonist diagram japaense.svg 400 × 300; 11 KB
-
Inverseagonist.gif 722 × 519; 15 KB
-
Inverser Agonist.png 632 × 316; 8 KB
-
-
-
Irreversible competitive antagonism plot.svg 650 × 470; 1 KB
-
-
-
Negative allosteric modulator agonist plot.svg 650 × 470; 1 KB
-
Negative allosteric modulator plot.svg 650 × 470; 1 KB
-
Nichtkompetitiver Antagonist.png 422 × 256; 4 KB
-
Positive allosteric modulator agonist plot.svg 650 × 470; 1 KB
-
Positive allosteric modulator antagonist plot.svg 650 × 470; 1 KB
-
Positive allosteric modulator plot.svg 650 × 470; 1 KB
-
Potency pharmacology-it.svg 521 × 398; 65 KB
-
Potency pharmacology.svg 521 × 398; 65 KB
-
Reversible competitive antagonism plot.svg 650 × 470; 1 KB
-
Selective-targeting-of-microglia-by-quantum-dots-1742-2094-9-22-S1.ogv 5.1 s, 288 × 227; 115 KB
-
-
-
-
-
Vibrio-coralliilyticus-Search-Patterns-across-an-Oxygen-Gradient-pone.0067975.s001.ogv 4.8 s, 1,288 × 968; 835 KB
-
-
-


