Category:Charts showing data through 2024
Jump to navigation
Jump to search
Deutsch: Statistiken bis zu und einschließlich 2024. Viele Grafiken fehlen hier noch – bitte hinzufügen.
English: Charts showing data up to and including 2024.
- Many charts are still missing – please help categorizing charts, e.g. from here. Outdated charts can often be updated. Only charts on notable subjects with specified data source(s) should be included.
| NO WIKIDATA ID FOUND! Search for Charts showing data through 2024 on Wikidata | |
| Upload media |
Subcategories
This category has the following 2 subcategories, out of 2 total.
Media in category "Charts showing data through 2024"
The following 24 files are in this category, out of 24 total.
-
 1979- Daily sea surface temperatures 60S-60N latitudes.png 2,135 × 1,397; 298 KB
-
 Anzahl der Dateien in Wikimedia Commons über Zeit.svg 4,236 × 1,896; 258 KB
-
 April2024airtemp.tif 4,096 × 2,461; 38.45 MB
-
 Bluesky Registered Users.svg 1,440 × 864; 39 KB
-
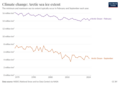 Climate change - Arctic sea ice extent.png 3,400 × 2,400; 445 KB
-
 Commons app active installs Aug 2024.png 1,518 × 762; 106 KB
-
 Commons cross-wiki uploads 2016-2024 - deletion.svg 823 × 478; 92 KB
-
-
 Countries-protecting-core-lgbt-rights.svg 850 × 600; 60 KB
-
 Daily Sea Surface Temperatures 60S-60N 1979-2023.png 2,550 × 1,650; 1.3 MB
-
 Divestment growth de.svg 1,200 × 600; 42 KB
-
 Divestment growth en.svg 1,200 × 600; 42 KB
-
 EUA prices from ICAP secondary market 2010 to 2024 clearer.gif 971 × 820; 35 KB
-
 Euro exchange rate to TRY.svg 800 × 400; 105 KB
-
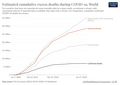 Excess-deaths-cumulative-economist-single-entity (1).png 3,400 × 2,400; 495 KB
-
 Global-monthly-temp-anomaly.png 3,400 × 2,400; 857 KB
-
 Known NEAs.png 1,200 × 800; 76 KB
-
 Known NEAs.svg 600 × 400; 164 KB
-
 Mauna Loa HFC-134a (CH2FCF3) concentration.png 1,200 × 900; 112 KB
-
 NEA 1 km or more.png 870 × 400; 50 KB
-
 NEA 1 km or more.svg 870 × 400; 39 KB
-
 NEA by survey (1995-2024).svg 870 × 400; 49 KB
-
 NEA by survey.png 870 × 400; 53 KB
-


_%E2%80%94_United_States,_January_1,_2020%E2%80%93March_28,_2024.png)


.png)


_concentration.png)


.svg)

.jpg)