Category:CNX Anatomy & Physiology Textbook
Jump to navigation
Jump to search
- Please note: This is not a category for pictures on Anatomy by CNX. It is for pictures from the CNX Anatomy & Physiology Textbook. If images in this category are histology, microbiology or otherwise not directly related to anatomy, they should not be removed.
Subcategories
This category has the following 11 subcategories, out of 11 total.
C
H
M
P
Media in category "CNX Anatomy & Physiology Textbook"
The following 174 files are in this category, out of 174 total.
-
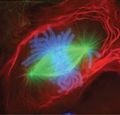
0300 Flourescence Stained new.jpg 1,350 × 795; 74 KB
-
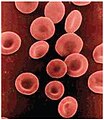
0300 Flourescence Stained.jpg 675 × 645; 225 KB
-
0305 Simple Diffusion Across Plasma Membrane labeled.jpg 726 × 339; 215 KB
-
0305 Simple Diffusion Across Plasma Membrane.jpg 810 × 339; 270 KB
-
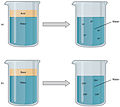
0307 Osmosis cleaned.jpg 544 × 260; 73 KB
-
0307 Osmosis cy.svg 544 × 308; 32 KB
-
0307 Osmosis.jpg 544 × 308; 109 KB
-
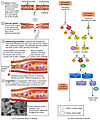
0337 Hematopoiesis new.jpg 2,307 × 1,896; 284 KB
-
0337 Hematopoiesis.jpg 957 × 305; 687 KB
-
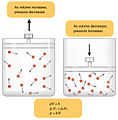
0346 Concentration of Solutions labeled.jpg 460 × 258; 96 KB
-
0346 Concentration of Solutions.jpg 460 × 238; 132 KB
-
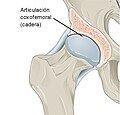
0910 Oateoarthritis Hip B esp.jpg 624 × 600; 118 KB
-
1003 Thick and Thin Filaments.jpg 830 × 765; 302 KB
-
1006 Sliding Filament Model of Muscle Contraction.jpg 818 × 643; 424 KB
-
1008 Skeletal Muscle Contraction.jpg 811 × 1,259; 478 KB
-
1009 Motor End Plate and Innervation.jpg 1,531 × 2,575; 1.33 MB
-
101 Levels of Org in Body.jpg 1,242 × 1,467; 485 KB
-
1010a Contraction new.jpg 838 × 1,105; 440 KB
-
1010b Relaxation new.jpg 750 × 914; 319 KB
-
1011 Muscle Length and Tension.jpg 634 × 479; 115 KB
-
1012 Muscle Twitch Myogram.jpg 789 × 506; 109 KB
-
1013 Summation Tetanus.jpg 763 × 314; 81 KB
-
1016 Muscle Metabolism (cropped).jpg 902 × 312; 110 KB
-
1016 Muscle Metabolism.jpg 902 × 1,014; 309 KB
-
1024 Treppe.jpg 371 × 314; 54 KB
-
1028 Smooth Muscle Contraction.jpg 1,126 × 233; 139 KB
-
103 Metabolism.jpg 671 × 590; 117 KB
-
105 Negative Feedback Loops.jpg 777 × 456; 164 KB
-
113abcd Medical Imaging Techniques.jpg 1,041 × 939; 769 KB
-
1200 Robotic Arms.jpg 975 × 731; 573 KB
-
1203 Concept of NucleusN.jpg 1,854 × 979; 567 KB
-
1205 Somatic Autonomic Enteric StructuresN.jpg 993 × 546; 378 KB
-
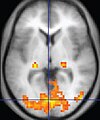
1206 FMRI.jpg 452 × 541; 87 KB
-
1221 Action Potential.jpg 686 × 435; 104 KB
-
1222 Action Potential Labels.jpg 739 × 435; 122 KB
-
1223 Graded Potentials-02.jpg 947 × 570; 259 KB
-
1224 Post Synaptic Potential Summation.jpg 804 × 514; 140 KB
-
1225 Chemical Synapse.jpg 1,005 × 930; 358 KB
-
1226 Receptor Types.jpg 985 × 1,210; 946 KB
-
1300 Human Nervous System.jpg 975 × 611; 757 KB
-
1301 Neural Tube Dev.jpg 1,171 × 441; 186 KB
-
1302 Brain Vesicle DevN (ja).jpg 1,204 × 431; 79 KB
-
1302 Brain Vesicle DevN.jpg 1,204 × 431; 209 KB
-
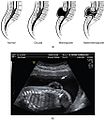
1304 Spina BifidaN.jpg 893 × 1,023; 395 KB
-
1400 CO Photo.jpg 653 × 494; 254 KB
-
1401 Receptor Types.jpg 2,092 × 1,038; 640 KB
-
1414 Rods and Cones - ru.svg 2,075 × 3,112; 494 KB
-
1415 Retinal Isomers.jpg 2,237 × 2,112; 954 KB
-
1425 Phineas Gage.jpg 883 × 1,483; 933 KB
-
1500 Fight or Flight.jpg 1,633 × 950; 1.52 MB
-
1514 Belladona Plant.jpg 1,633 × 1,233; 2.1 MB
-
1800 Child Catching Leaf new.jpg 1,500 × 1,334; 1.68 MB
-
1818 The Adrenal Glands-ar.jpg 1,102 × 316; 106 KB
-
1818 The Adrenal Glands-es.jpg 1,300 × 373; 318 KB
-
1818 The Adrenal Glands.jpg 1,102 × 316; 250 KB
-
1822 The Homostatic Regulation of Blood Glucose Levels.jpg 1,054 × 1,478; 658 KB
-
1900 Blood cells.jpg 1,975 × 1,300; 938 KB
-
1901 Composition of Blood.jpg 1,517 × 950; 371 KB
-
1902 Hemopoiesis.jpg 2,271 × 1,725; 688 KB
-
1903 Shape of Red Blood Cells.jpg 614 × 706; 290 KB
-
1905 Erythrocyte Life Cycle.jpg 2,167 × 2,817; 1.9 MB
-
1906 Emigration.jpg 1,990 × 2,496; 1.47 MB
-
1907 Granular Leukocytes.jpg 1,454 × 475; 322 KB
-
1908 Platelet Development.jpg 846 × 1,225; 214 KB
-
1909 Blood Clotting.jpg 2,125 × 2,558; 1.85 MB
-
1910 Erythroblastosis Fetalis.jpg 2,242 × 2,050; 1.29 MB
-
1912 Cross Matching Blood Types.jpg 1,933 × 786; 759 KB
-
1913 ABO Blood Groups.jpg 1,812 × 1,392; 576 KB
-
1914 Table 19 3 1.jpg 2,263 × 3,383; 2.51 MB
-
1915 Table 19 01 Major Blood Components.jpg 975 × 1,106; 412 KB
-
1916 Leukocyte Key.jpg 1,988 × 467; 443 KB
-
200 DNA Double Helix-02.jpg 1,975 × 1,492; 726 KB
-
202 Two Models of Atomic Structure.jpg 1,012 × 1,537; 314 KB
-
2020 SA Node Tracing.jpg 1,667 × 800; 293 KB
-
2022 Electrocardiogram.jpg 1,658 × 1,086; 566 KB
-
2023 ECG Tracing with Heart ContractionN.jpg 2,206 × 1,613; 750 KB
-
203 Periodic Table-02.jpg 3,045 × 2,365; 3.59 MB
-
2035 Factors in Stroke Volume.jpg 2,233 × 1,263; 994 KB
-
2037 Embryonic Development of Heart fr.jpg 2,267 × 1,954; 1.17 MB
-
2037 Embryonic Development of Heart-ar.jpg 2,267 × 1,954; 730 KB
-
2037 Embryonic Development of Heart.jpg 2,267 × 1,954; 1.21 MB
-
2101 Blood Flow Through the Heart esp.jpg 1,942 × 1,317; 604 KB
-
2101 Blood Flow Through the Heart.jpg 1,942 × 1,317; 728 KB
-
2108 Capillary Exchange.jpg 975 × 458; 264 KB
-
2108 Capillary ExchangeN.jpg 1,961 × 914; 666 KB
-
211 Three Fundamental Chemical Reactions-01.jpg 1,873 × 725; 378 KB
-
2113ab Atherosclerosis.jpg 1,965 × 1,065; 1.52 MB
-
2114 Skeletal Muscle Vein Pump.jpg 1,332 × 1,165; 608 KB
-
2118 Blood Volume Loss and Homeostasis.jpg 1,967 × 1,036; 419 KB
-
212 Enzymes-01.jpg 2,140 × 863; 336 KB
-
213 Dehydration Synthesis and Hydrolysis-01.jpg 2,028 × 1,053; 462 KB
-
2142 Distribution of Blood Flow.jpg 1,542 × 1,425; 450 KB
-
2143 Mechanism Regulating Arteries and Veins.jpg 2,183 × 2,650; 1.55 MB
-
215 Acids and Bases-01.jpg 1,928 × 1,719; 553 KB
-
216 pH Scale-01.jpg 1,153 × 2,339; 561 KB
-
2203 Lymphatic Trunks and Ducts System.jpg 870 × 678; 267 KB
-
2208 Spleen.jpg 1,036 × 979; 506 KB
-
2209 Location and Histology of Tonsils.jpg 910 × 1,173; 540 KB
-
2211 Cooperation Between Innate and Immune Responses.jpg 1,119 × 986; 454 KB
-
2212 Complement Cascade and Function.jpg 1,102 × 1,154; 377 KB
-
2213 Inflammatory Process.jpg 1,066 × 1,112; 771 KB
-
2214 Antigenic Determinants.jpg 835 × 679; 177 KB
-
2215 Alpha-Beta T Cell Receptor.jpg 494 × 452; 117 KB
-
2216 Antigen Processing and Presentation.jpg 1,128 × 890; 526 KB
-
2217 Differentiation of T Cells Within the Thymus.jpg 1,116 × 1,451; 697 KB
-
2218 Clonal Selection and Expansion of T Lymphocytes.jpg 764 × 733; 283 KB
-
2219 Pathogen Presentation.jpg 732 × 760; 275 KB
-
2220 Four Chain Structure of a Generic Antibody IgG2 Structures ar.png 1,940 × 772; 617 KB
-
2220 Four Chain Structure of a Generic Antibody-IgG2 Structures.jpg 970 × 386; 210 KB
-
2221 Five Classes of Antibodies new.jpg 2,242 × 2,100; 965 KB
-
2222 Clonal Selection of B Cells hu.jpg 1,024 × 938; 214 KB
-
2222 Clonal Selection of B Cells.jpg 1,117 × 1,023; 539 KB
-
2223 Primary and Secondary Antibody Respons new.jpg 548 × 381; 50 KB
-
2224 T and B Cell Binding.jpg 796 × 294; 122 KB
-
2226 IgA Immunity.jpg 1,120 × 1,056; 671 KB
-
2228 Immune Hypersensitivity new (cropped).jpg 1,088 × 1,316; 221 KB
-
2228 Immune Hypersensitivity new.jpg 4,517 × 3,492; 2.26 MB
-
2314 Boyles Law.jpg 1,421 × 1,450; 380 KB
-
2318 Partial and Total Pressure of a Gas.jpg 1,863 × 648; 327 KB
-
2319 Fig 23.19.jpg 1,940 × 1,150; 610 KB
-
2320 Fig 23.20 NEW KGX.jpg 2,165 × 980; 427 KB
-
2322 Fig 23.22-a.jpg 1,200 × 1,233; 362 KB
-
2324 Oxygen-hemoglobin Dissociation Fetus Adult.jpg 1,881 × 1,433; 268 KB
-
2325 Carbon Dioxide Transport - ru.svg 1,906 × 929; 35 KB
-
2325 Carbon Dioxide Transport.jpg 1,927 × 950; 481 KB
-
2328 Development of Lower Respiratory SystemN.jpg 1,950 × 1,481; 732 KB
-
2431 Lipid Absorption.jpg 640 × 827; 350 KB
-
2517 Protein-Digesting Enzymes.jpg 1,817 × 1,569; 806 KB
-
2600 Sewage Treatment Plan.jpg 1,971 × 1,346; 1.51 MB
-
2619 Substances Reabsorbed And Secreted By The PCT.jpg 2,232 × 1,600; 824 KB
-
2625 Aquaporin Water Channel.jpg 1,342 × 675; 377 KB
-
2701 Water Content in the Body-01.jpg 1,611 × 2,283; 752 KB
-
2702 Fluid Compartments ICF ECF.jpg 677 × 456; 241 KB
-
2710 Aquaporins-01.jpg 1,464 × 1,067; 484 KB
-
2713 pH Scale-01.jpg 1,069 × 1,833; 447 KB
-
2900 Photo of Neonate-02.jpg 1,651 × 1,327; 1.29 MB
-
2903 Preembryonic Cleavages-02.jpg 1,549 × 1,359; 912 KB
-
2904 Preembryonic Development-02.jpg 1,957 × 1,792; 1.12 MB
-
2905 Implantation.jpg 1,950 × 2,440; 1.04 MB
-
2906 Placenta Previa-02.jpg 1,599 × 1,017; 505 KB
-
2907 Embroyonic Disc, Amniotic Cavity, Yolk Sac-02-NLtxt.jpg 1,503 × 1,055; 689 KB
-
2907 Embroyonic Disc, Amniotic Cavity, Yolk Sac-02.jpg 1,529 × 1,055; 551 KB
-
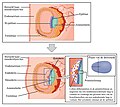
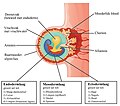
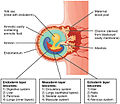
2908 Germ Layers-02-nltxt.jpg 1,854 × 1,658; 1.45 MB
-
2908 Germ Layers-02.jpg 1,781 × 1,590; 1.06 MB
-
2909 Embryo Week 3-02 NLtxt.jpg 1,446 × 1,276; 855 KB
-
2909 Embryo Week 3-02.jpg 1,447 × 1,252; 634 KB
-
2910 The Placenta-02 hr.jpg 2,059 × 1,068; 271 KB
-
2910 The Placenta-02-ar.jpg 2,059 × 1,068; 411 KB
-
2910 The Placenta-02.jpg 2,059 × 1,068; 1,001 KB
-
2912 Neurulation-02 nltxt.jpg 2,500 × 2,500; 2.1 MB
-
2912 Neurulation-02.jpg 1,952 × 2,255; 1.18 MB
-
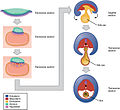
2913 Embryonic Folding.jpg 1,894 × 1,735; 831 KB
-
2914 Photo of Embryo-02.jpg 1,270 × 1,356; 849 KB
-
2915 Sexual Differentation-02.jpg 1,297 × 2,444; 665 KB
-
2916 Fetal Circulatory System-02.jpg 2,235 × 1,948; 1.52 MB
-
2917 Size of Uterus Throughout Pregnancy-02-ar.jpg 449 × 599; 56 KB
-
2917 Size of Uterus Throughout Pregnancy-02.jpg 1,312 × 1,750; 403 KB
-
2919 Hormones Initiating Labor-02-ar.jpg 800 × 449; 52 KB
-
2919 Hormones Initiating Labor-02.jpg 1,578 × 886; 293 KB
-
2920 Stages of Childbirth-02-es.jpg 1,890 × 2,958; 1.96 MB
-
500 Splash Image.jpg 1,117 × 886; 602 KB
-
600 Child Looking at Bones.jpg 975 × 731; 668 KB
-
819 Embryo at Seven Weeks.jpg 702 × 750; 353 KB
-
Anchoring junctions.png 1,602 × 1,150; 887 KB
-
Coeur step 1.jpg 2,259 × 1,062; 518 KB
-
Electrocardiogram Depolarization.jpg 800 × 524; 87 KB
-
Embryonic origin of ectoderm.png 836 × 402; 411 KB
-
Embryonic origin of endoderm.png 838 × 388; 336 KB
-
Embryonic origin of mesoderm.png 838 × 322; 282 KB
-
Gap junction.png 708 × 654; 197 KB
-
Post Synaptic Potential Summation Depolarization.jpg 800 × 511; 66 KB
-
Sodium Channels Open Closed Depolarization.jpg 321 × 599; 44 KB
-
The Neuron Depolarization.jpg 800 × 535; 77 KB
-
Tight cell junction.png 716 × 658; 265 KB

