Category:2018 United States House election maps
Jump to navigation
Jump to search
Subcategories
This category has the following 23 subcategories, out of 23 total.
A
C
I
K
M
N
O
Media in category "2018 United States House election maps"
The following 114 files are in this category, out of 114 total.
-
116th US Congress House.png 3,507 × 2,234; 808 KB
-
116th US Congress House.svg 512 × 317; 60 KB
-
2016VAUSHouse Holds and Gains.svg 463 × 203; 223 KB
-
2018 AR-1 Election Results.svg 800 × 846; 482 KB
-
2018 Changes to U.S. House Delegations.png 1,123 × 792; 193 KB
-
2018 Changes to U.S. House Delegations.svg 512 × 317; 60 KB
-
2018 Congressional Election in Connecticut.svg 810 × 595; 85 KB
-
2018 Congressional election in Illinois' 1st district by county.svg 800 × 664; 19 KB
-
2018 D transparent.gif 1,024 × 594; 111 KB
-
2018 D white.gif 1,024 × 594; 108 KB
-
2018 DE-AL GOP primary.svg 400 × 810; 5 KB
-
2018 general election in Texas' 28th congressional district.svg 800 × 1,234; 106 KB
-
2018 general election in Virginia's 1st congressional district by county.svg 800 × 1,004; 1.55 MB
-
2018 Illinois 2nd district Republican primary results map.svg 800 × 887; 19 KB
-
2018 LA-3 Election Results.svg 800 × 381; 200 KB
-
2018 MN-1.svg 601 × 219; 82 KB
-
2018 MS-2.svg 800 × 1,490; 975 KB
-
2018 NE-1 Election Results by Precinct.svg 1,052 × 744; 1.78 MB
-
2018 R transparent.gif 1,024 × 594; 129 KB
-
2018 R white.gif 1,024 × 594; 129 KB
-
2018 Texas's 34th congressional district election results map by county.svg 800 × 2,702; 74 KB
-
2018 U.S. House elections in Arizona.svg 512 × 673; 110 KB
-
2018 U.S. House elections in Connecticut.svg 810 × 595; 99 KB
-
2018 U.S. House elections in Georgia.svg 280 × 323; 166 KB
-
2018 U.S. House elections in Hawaii.svg 626 × 383; 89 KB
-
2018 U.S. House elections in Illinois.svg 810 × 810; 448 KB
-
2018 U.S. House elections in Kentucky.svg 810 × 357; 41 KB
-
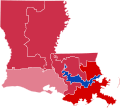
2018 U.S. House elections in Louisiana.svg 316 × 284; 159 KB
-
2018 U.S. House elections in Maryland.svg 239 × 125; 229 KB
-
2018 U.S. House elections in Mississippi.svg 207 × 337; 94 KB
-
2018 U.S. House elections in Missouri.svg 361 × 317; 151 KB
-
2018 U.S. House elections in Nebraska.svg 810 × 379; 34 KB
-
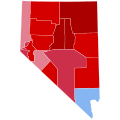
2018 U.S. House elections in Nevada.svg 810 × 810; 29 KB
-
2018 U.S. House elections in Virginia.svg 463 × 203; 223 KB
-
2018 U.S. House elections in Washington.svg 369 × 242; 234 KB
-
2018 US House Election Results cartogram.svg 1,040 × 693; 59 KB
-
2018 US House Election Results.png 5,846 × 3,719; 2.61 MB
-
2018HIUSHouse.svg 663 × 450; 52 KB
-
2018MEUSHouse Holds and Gains.svg 01.svg 810 × 810; 40 KB
-
2018NYUSHouse.svg 744 × 577; 195 KB
-
2018RICong by Municipality.svg 810 × 810; 49 KB
-
2018TXUSHouse.svg 810 × 769; 477 KB
-
2018VAUSHouse Holds and Gains.svg 463 × 203; 223 KB
-
American Samoa 2018 U.S. House election map.svg 755 × 504; 56 KB
-
Delaware House Election Results by County, 2018.svg 810 × 810; 6 KB
-
Kansas House elections 2018.svg 1,242 × 721; 39 KB
-
Maine Distrct 2 2018.svg 125 × 156; 107 KB
-
Maine District 1 2018.svg 455 × 421; 47 KB
-
2018 MN-7.svg 799 × 1,407; 204 KB
-
Min072018Results.svg 315 × 755; 170 KB
-
MN2 House 2018.svg 1,052 × 744; 801 KB
-
MN3 House 2018.svg 1,052 × 744; 800 KB
-
MN4 House 2018.svg 1,052 × 744; 479 KB
-
MN5 House 2018.svg 1,052 × 744; 361 KB
-
MN6 House 2018.svg 1,052 × 744; 1.41 MB
-
MN7 House 2018.svg 310 × 744; 3.43 MB
-
MN8 House 2018.svg 1,052 × 744; 3.26 MB
-
MN1 House 2018.svg 1,052 × 383; 1.87 MB
-
ND-AL 2018 by county.svg 810 × 488; 28 KB
-
NVUSHouse2018.svg 330 × 471; 49 KB
-
NewYorkCongD1(2018).svg 800 × 450; 327 KB
-
NewYorkCongD13(2018).svg 800 × 450; 13 KB
-
2018 NC-09 D primary.svg 1,070 × 514; 150 KB
-
2018 NC-09 GOP primary.svg 926 × 436; 144 KB
-
NorthCarolina2018HouseofRepsElection.svg 810 × 316; 142 KB
-
Northern Mariana Islands 2018 U.S. House election map.svg 569 × 891; 39 KB
-
2018 NV-2.svg 800 × 618; 83 KB
-
2018 NV-4.svg 800 × 781; 45 KB
-
PA10 House 2018.svg 800 × 1,138; 1.72 MB
-
PA11 House 2018.svg 800 × 562; 1.79 MB
-
PA12 House 2018.svg 800 × 714; 2.36 MB
-
PA13 House 2018.svg 800 × 428; 3.1 MB
-
PA14 House 2018.svg 800 × 809; 2.82 MB
-
PA15 House 2018.svg 800 × 753; 2.81 MB
-
PA16 House 2018.svg 800 × 1,787; 1.87 MB
-
PA18 House 2018.svg 800 × 763; 1.86 MB
-
PA2 House 2018.svg 800 × 975; 746 KB
-
PA3 House 2018.svg 800 × 1,201; 815 KB
-
PA4 House 2018.svg 800 × 664; 1.11 MB
-
PA5 House 2018.svg 800 × 586; 1.36 MB
-
PA7 House 2018.svg 800 × 833; 1.01 MB
-
PA8 House 2018.svg 800 × 862; 1.67 MB
-
PA9 House 2018.svg 800 × 952; 2.21 MB
-
South Dakota House Election Results by County, 2018.svg 810 × 506; 30 KB
-
Tennessee Congressional Election Results 2018.svg 810 × 206; 141 KB
-
United States House of Representatives election in Minnesota, 2018.svg 810 × 810; 108 KB
-
US House 2018 voteshare.svg 1,242 × 720; 2.2 MB
-
US House 2018.svg 1,242 × 720; 2.19 MB
-
Vermont House Election Results by County, 2018.svg 810 × 810; 17 KB
-
Washington Congressional Election Results 2018.svg 810 × 535; 193 KB
-
WY House 2018.svg 810 × 624; 4.74 MB


