Hi again, I wanted to update Sudurpaschim province map as it does not show the Kalapani/Lipulekh disputed territory which involves changing the top boundary of the map. I wasn't sure how to update the relief map - as all the Nepal maps seem to already have the same relief scheme which I don't know how to implement, and I can't reuse the original relief because it isn't for the right coordinates. Is it OK that I replace the relief in this instance with the relief scheme on English wikipedia so that the boundaries are accurate? Also how do I shade in this disputed territory, as although Nepal claims it India controls it? C1MM (talk) 06:21, 5 January 2022 (UTC)[reply]
OK, thanks. I fixed the template. I was more curious about showing disputed territories on the location map itself given that in this case Nepal claims the territory but does not control it. I can also fix the district locator maps as well. C1MM (talk) 05:09, 6 January 2022 (UTC)[reply]
I noticed that some parts of land shown inside the Nepal international border were still coloured as if they were part of India, such as in Dadeldhura district. Is there any way to fix this? If you look at the history I did upload a map correcting the locations of the rivers (I grabbed Landsat 8 data for this) before realizing I couldn't update the relief map in your style. Where is the style guideline for the kind of relief you do? C1MM (talk) 06:00, 6 January 2022 (UTC)[reply]
Dadeldhura: Classic problem of cartography. I showed the boundary on the western side of the river although the river is the boundary. This is a cartographic solution when two lines lie on top of each other and you want to show them both. (E.g. in India Uttar Pradesh location map.svg it is impossible to say if Lucknow district is on both sides of Gomti River or if there are two districts, a bigger one in the south and a small one in the north. But if you put the boundaries on top you will have a problem with the rivers.) I could have taken the boundary line as the outline of the Sudurpashchim area, too, but if you highlight that area like in Dadeldhura Sudurpashchim locator.png everybody will see that immediately and think that Sudurpashchim is on both sides of the river. The small bends which prevent that the boundary line can follow the river everywhere are the problem is this case but a) this map is usually used with 300px or less and b) the difference between the grey and the yellow is so small that is almost impossible to detect it in this usual size. So I think this graphic problem can be neglected.
Guideline: no guideline. I use a colour scheme for all new relief maps but colour X doesn't show the same height in every map. It has to look good and understandable and has to show as much information as possible. In the Alps 4000 m is very high, in the Himalayas it isn't, so I change the colour scheme heights for each country a bit. It's cartography, not a tool for height measurements. NNW17:03, 6 January 2022 (UTC)[reply]
Hallo, ich habe was gerade auf eine Disk. geschrieben, aber ich hinterlasse gern auch hier einen Hinweis. Mir gefallen deine Karten zu Schleswig/Holstein sehr, aber es hat sich ein Fehler eingeschlichen: Schleswig war niemals Mitglied im Deutschen Bund, auch nicht nach dem Deutsch-Dänischen Krieg. Die Situation, dass Holstein und Lauenburg sehr wohl Mitglieder waren und Schleswig nicht, hat man in der kurzen Zeit, in der es den Bund noch gab, nicht mehr verändert. Ziko (talk) 14:32, 9 January 2022 (UTC)[reply]
If you created this file, please note that the fact that it has been proposed for deletion does not necessarily mean that we do not value your kind contribution. It simply means that one person believes that there is some specific problem with it, such as a copyright issue. Please see Commons:But it's my own work! for a guide on how to address these issues.
Please remember to respond to and – if appropriate – contradict the arguments supporting deletion. Arguments which focus on the nominator will not affect the result of the nomination. Thank you!
And can you also update File:TCDD.svg and its duplicate File:Tcdd network.png as well? I recently discovered these two maps which are used in Wikipedia articles.
I apologize for my carelessness.
Those are the last maps that have not been updated, and there are no other related maps that need updates. I have thoroughly checked the categories, to be sure. --Multituberculata (talk) 21:46, 12 February 2022 (UTC)[reply]
This is idiotic. Far too many maps showing all the same and when the uploaders leave there is no one who wants to update them all. NNW20:22, 14 February 2022 (UTC)[reply]
Hi Multituberculata, you brutally reverted all the many corrections which I had made on File:High Speed Railroad Map of Europe.svg and this without even writing any reason for your revert. However, from what I can read above, it seems that you did this because my changes included putting back Konya-Karaman (TK) in yellow since it is designed for 200 km/h. It seems that you would like it to be in orange (240-260 km/h), however this line has been designed for 200 km/h (see Turkey: Konya-Karaman rapid railway line opens. UIC (International Union of Railways). Retrieved on 23 February 2022.) so the correct color of this section is yellow. Carfois (talk) 17:02, 8 March 2022 (UTC)[reply]
Hi NordNordWest! I was interested as to whether you make your maps in a GIS software like QGIS, or a vector graphics software like Inkscape, I was interested in how you make the country boundaries go under the water! — Berrely • T∕C18:10, 13 January 2022 (UTC)[reply]
Hello! I use both ArcGis and Illustrator (sometimes Inkscape) depending on what I want to do, sometimes both programs, sometimes only Illustrator. I think you are the first one to ask how to bring boundaries under the water, the others asked how I made a boundary going parallely to a river so both can be seen. :o) Well, I work with layers and the boundary would be under the layer for waterbodies. You need to duplicate a river if the boundary data isn't exactly the same and use it as a boundary. Or did I misunderstand your question? If yes, please give an example where I did what you want to know. NNW12:23, 14 January 2022 (UTC)[reply]
Nope that answered it perfectly :) I'll try to use water layers with the boundaries, many thanks! I hope you have a good day :D — Berrely • T∕C18:37, 14 January 2022 (UTC)[reply]
Hi there. I remixed a map of yours and reuploaded it, trying to meet a map requested for a page. The data I added to it I created myself, but this is my first time uploading something to Wikimedia Commons, let alone a remixed work, so I wanted to see if my upload meets the requirements of your CC BY SA license on your original map. https://commons.wikimedia.org/wiki/File:Bruce_Trail.png is the link. Wanted to give a heads up of a few days before I try and insert it into the page. Any advice or concerns? --Kwkintegrator (talk) 09:51, 14 January 2022 (UTC)[reply]
Hello. I'm looking to create location maps for all districts of Azerbaijan and I was wondering where you got the data for your province maps (specifically the data for the small rivers, e.g. here) and what program you use to create them. — Goldencall me maybe?09:25, 23 January 2022 (UTC)[reply]
Hello! The rivers in the Nepal maps are taken from VMAP Level 0 and corrected, especially according to the relief version (they should be in the valleys, not on a hillside). VMAP Level 0's scale is 1:1.000.000, this could be too small for district maps of Azerbaijan, perhaps you try OSM data but I don't know if it is good enough in Azerbaijan. I usually create those maps with Abobe Illustrator. NNW14:11, 23 January 2022 (UTC)[reply]
One last thing. Could you remove the dotted borders in Northeast India? I don't think China's territorial claims there are relevant. Thanks again. LittleJerry (talk) 01:20, 29 January 2022 (UTC)[reply]
Hi, kannst du bitte mal überprüfen ob ich deine Bilder dem richtigen Zotzensee zugeordnet habe? Category:Zotzensee? Es wäre auch nett, wenn du die CATs richtig zuordnen könntest. Ich hab die ursprüngliche Zuordnung so gelassen, da ich die Gegend nicht ausreichend gut kenne. Danke. --Derzno (talk) 03:55, 3 February 2022 (UTC)[reply]
Hallo! Die Bilder sind richtig zugeordnet. Ich denke nur, dass die Category:Zotzensee unnötig ist. Zwei Seen mit gleichem Namen brauchen keine Kat, in der sie zusammengefasst sind. Viele Grüße, NNW08:08, 3 February 2022 (UTC)[reply]
No, I haven’t (and I don’t use QGIS). The linked page says there is data for 0 m and for 200 m. The Persian Gulf doesn’t reach 200 m, so there can only be data in the 0 m dataset.
Moin! Grundsätzlich ja. Hast du eine vernünftige Quelle? Das hier abzuzeichnen ergibt ja keinen Sinn. Und das muss noch warten, ich sitze gerade an den Distrikten von Tansania. NNW11:22, 2 March 2022 (UTC)[reply]
Hello! Canada Nova Scotia location map.svg was made using VMAP Level 0 data (i.e. 1:1.000.000 data) for the coastline and Statistics data for the boundaries. The VMAP data was importated to Illustrator (you really do not want to redraw it). There is no problem to use the data in a slightly smaller scale like this. You should always use a larger scale to produce a smaller scale, that's cartographical standard. You can reduce the amount of vector points of a line in Illustrator to reduce the file size if you want to.
If you want to produce a location map for a town you should start with OSM data. Download it, open it in Illustrator, reduce the data, change the colours etc. That's all and much faster than a redrawing. NNW18:24, 17 March 2022 (UTC)[reply]
Hello! I usually end the updating of location maps when a "adm" version is available but I updated it now for you. You could have copied the missing boudaries from the "adm" version, too. It's the same scale. NNW16:58, 21 March 2022 (UTC)[reply]
Nur eine Kleinigkeit: Dir ist darin ein Typo unterlaufen: Das Dorf zwischen Ribbeck und Retzow heißt Selbelang, nicht Selbeland:
https://de.wikipedia.org/wiki/Selbelang
Moin NNW, hat es einen Grund, zum Beispiel Hamburg-administrativ, dass auf der Karte die Wilstorfer/Winsener Straße nicht als "Bundesstraße" eingezeichnet ist, obwohl dort die B4 verläuft? Schöne Grüße, 131Platypi (talk) 09:47, 7 April 2022 (UTC)[reply]
Well there are boundaries in OpenStreetMap, but they're only visible when zoomed in. Otherwise, there have been people that made the regions' subdivisions [as this] but it didn't show nationwide map. --ShadZ01 (talk) 22:23, 10 April 2022 (UTC)[reply]
I don't understand what you want about map updates. You told me to update the map of Estonia instead of having a new file and replacing the first one on every wiki. OK. So I tried to do just that with Cremona's locator map. Why are we supposed to change the file on every wiki now? Is it not much easier to keep all the File:(province name) in Italy.svg up to date? (I understand that Cremona should not be an exception, but then it should be done for all provinces). --GrandEscogriffe (talk) 22:26, 15 April 2022 (UTC)[reply]
If there is a whole set of alternative maps then there is or was a reason for it. It's quite some time ago so I might remember it incorrectly but I think it was because of that strange Italian thing to create new provinces while the old ones were still active. So there was the need for a new pair of maps because de:wp wanted to show the new provinces but in it:wp they still worked with the old ones.
Besides these maps: This is a collaborative project. That means: Communicate. Ask. Before doing anything especially if you don't understand why things are in a way you don't understand. I'm still very active on this project, so you will get an answer soon. And of course it is senseless to change only one map with 103 maps unchanged. NNW07:31, 16 April 2022 (UTC)[reply]
ich möchte mich herzlich für die tolle Karte zu allen deutschen Ministerpräsidenten bedanken. Ich finde sie sehr hilfreich! Da auch kommissarische Ministerpräsidenten inkludiert werden, frage ich mich, ob nicht auch Joachim Stamp (FDP) zwischen Armin Laschet und Hendrik Wüst für NRW eingefügt werden müsste, auch wenn er nur einen Tag lang kommissarischer Ministerpräsident war.
Moin! Da müsste ich mal schauen, wie ich das bislang gehandhabt habe. Wenn sonst alle dargestellt sind, dann kommt natürlich auch Hr. Stamp dazu. Viele Grüße, NNW06:03, 26 April 2022 (UTC)[reply]
Du hattest diese Kategorie angelegt. Mittlerweile gibt es ein weiteres Denkmal auf dem Platz der Republik. 2 Bilder habe ich schon hochgeladen, aber die passen natürlich nicht ganz in diese Kategorie. Vielleicht kannst du irgendeine Lösung für eine gemeinsame Kategorie finden, mich überfordert das Kategoriensystem meistens.--Hinnerk11 (talk) 16:38, 21 May 2022 (UTC)[reply]
Wir brauchen zwei Kats, z.B. mit Klammerzusatz „(Hamburg-Bahrenfeld)“ und „(Hamburg-Altona-Altstadt)“, und Category:Süleyman Taşköprü memorial wird dann zu einer Begriffsklärungsseite umgewandelt. Beide Denkmäler in einer Kat funktioniert wegen der zwei Orte nicht. NNW15:12, 22 May 2022 (UTC)[reply]
Die beiden Kategorien habe ich erstellt und befüllt. Könntest du die Umwandlung der jetzigen zur Begriffsklärungsseite übernehmen?--Hinnerk11 (talk) 09:45, 24 May 2022 (UTC)[reply]
If you created this file, please note that the fact that it has been proposed for deletion does not necessarily mean that we do not value your kind contribution. It simply means that one person believes that there is some specific problem with it, such as a copyright issue. Please see Commons:But it's my own work! for a guide on how to address these issues.
Please remember to respond to and – if appropriate – contradict the arguments supporting deletion. Arguments which focus on the nominator will not affect the result of the nomination. Thank you!
Hi NordNordWest,
Thank you for your contributions to Commons. I noticed File:Taiwan relief location map.jpg is out of date. The earlier forms of this map did not extend a dotted-line around Dongyin, Lienchiang (Tungyin). The northern edge of this map ought to be moved up a little bit (in latitude) so that a dotted line encompassing Dongyin (Tungyin) can be clearly drawn and so that we can see a few of the islands north of Lienchiang County in Haidao Township, PRC. Example of a better map from The Economist: [4]. Could you update it? Thanks again. Geographyinitiative (talk) 17:17, 29 May 2022 (UTC)[reply]
Hallo lieber NordNordWest! Darf ich dich herzlich bitten, ein Liniensymbol für die neue Linie S6 (siehe hier) zu erstellen, wenn du Zeit findest? Super übrigens, dass du den schematischen Netzplan so schnell aktualisiert hast.--MissyWegner (talk) 06:16, 29 June 2022 (UTC)[reply]
Wie konnte ich nur jemals in Zweifel ziehen, dass du die Änderungen nicht unverzüglich umsetzt? Der neue topographische Netzplan sieht sehr cool aus, diese frischen Farben wirken ja mal richtig angenehm. Super, dann kann ich mich ja mal an die Anpassung des Artikels machen. Was die neue Schriftart angeht: Persönlich hoffe ich, dass der HVV die Liniensymbole nicht anpasst, da ich die hierfür vorgeschlagene Schriftart etwas sehr grobschlächtig und zu flashy finde...--MissyWegner (talk) 07:57, 29 June 2022 (UTC)[reply]
Da hat man sich gerade erst an den Plan "gewöhnt", ändern die den einfach ... ts. Als Außenstehender finde ich es aber schlüssig. Grüße Lencer (talk) 13:07, 29 June 2022 (UTC)[reply]
I know why you reverted my edit for not showing disputed marks (I was trying to show de-facto situation), yet on the File:India location map.svg the de-facto situation alone is being shown. For consistency we should add the disputed lines on all maps or not include them. If I added lines to show the territory is disputed would my map be acceptable? Or are there other issues you see with it? C1MM (talk) 15:06, 12 July 2022 (UTC)[reply]
De facto: both India and Pakistan want to have J&K. It doesn't matter if there is India location map.svg because there are several other location maps of India and all of them are used in some Wikipedias. And last not least you changed the size of the file. Some Wikipedia templates work with size of a file so it is forbidden to change it. NNW17:03, 13 July 2022 (UTC)[reply]
Moin NNW, ich beschäftige mich gerade mit der Deichstrasse und trage die Häuser auf der Karte Katharinenstrasse 9 ein. Jetzt stosse ich an die Grenze und es wäre schön, wenn Du mir eine Karte machen könntest, auf der auch die westliche Seite der Deichstrasse enthalten ist und ohne Katharinenstrasse Zeiger. Oursana (talk) 09:30, 17 July 2022 (UTC)[reply]
Hello! I am a bit in a hurry so I cannot answer your questions now. I'll do it next weekend if this is okay for you. Regards, NNW06:14, 28 August 2022 (UTC)[reply]
a) WDB II is some old free CIA map data (see e.g. https://www.evl.uic.edu/pape/data/WDB/). It has some rivers suitable for maps of whole countries or other large areas but it is useless for provinces (only the main rivers and very generalized). NIMA data is en:Vector Map Level 0. It is also quite old but very suitable as a start for country maps. You have to control and update both data sets because of its age but both sets are generalized, so it is possible to work quite fast. You don't have to deal with all that small and often needless OSM pieces.
b) You cannot stretch in ArcGIS because stretching destroys the map projection. You need to have a program like Adobe Illustrator or Inkscape (which don't know anything about projections) after creating the map in ArcGIS.
c) Your file would be smaller if the rivers would be lines, not polygons, but that's not really important. I think it is better to have all waterbodies in the same colour but of course you show quite a lot rivers and it keeps the map more readable with lighter rivers.
Thank you NNW for the reply, it is very useful. Annoyingly QGIS made the rivers polygons on SVG export (I'm not sure why), and yes I changed the opacity because there were many rivers. Thanks for your help :) — Berrely • T∕C16:35, 5 September 2022 (UTC)[reply]
Update request for Karte Bundesautobahn 22.png[edit]
Könntest Du evtl auf der Karte >Karte Bundesautobahn 22.png< beim nächsten update den Ort Buxtehude (ja gibt es wirklich) ergänzen. Liegt an der Este die eingezeichnet ist südlich der Autobahn. Grund dieser Ort spielt in dem Artikel A26 eine Rolle ob der Ort jetzt eine Abfahrt bekommt oder nicht. Titel als Hansestadt wurde dem Ort verliehen aufgrund des Baus der Autobahn wie in dem Artikel beschrieben etc. Danke für die Karte 163.116.173.5215:07, 31 August 2022 (UTC)[reply]
Copy/paste mistake in the file description, thanks for your sharp eyes. :o) Unlike the Islamabad map this one is not showing an administrative unit and so it is impossible to divide it into a yellow and a grey area (just like Denmark Greater Copenhagen adm location map.svg or Baltic Sea adm location map.svg). There are three disticts but they don't sum up to Kathmandu Valley. So administrative boundaries are not so important in this map. NNW09:43, 25 September 2022 (UTC)[reply]
Hey @NordNordWest, I just wanted to let you know that three new regions were formed in Kazakhstan under Presidential Decree in the beginning of June 2022 and your maps remained unchanged. I also wanted there to be an SVG map for Kazakhstan's districts and so I decided to give it a try for myself redo your styled map of Kazakhstan's administrative districts. So this took a very while in which I basically used others works maps of regions' districts and then redrew the borders into your map. I also added borders for newly formed regions which I carefully analyzed as they were all formed from existing districts. If you want to take a look at it and maybe make some fixes or modifications which it would be greatly appreciated then please take a look. As for the image info, you can also change it, as I would suggest for us to be both credited as authors. As for your both location maps, you could update them using my template for districts map I did.
Hello and thanks for telling me! It is impossible for me to find all changes in all countries myself. That's why the Kazakhstan location map isn't updated (noone told me) but I will do it next week. Best regards, NNW06:02, 29 September 2022 (UTC)[reply]
Hallo, du hast netterweise die Karte dazu erstellt. Nun tritt das Abkommen ab 1.11.2022 auch für Griechenland in Kraft. Griechenland müsste daher die Farbe von hellblau zu dunkelblau Wechseln. Danke schon mal vorab. Hdeinert2002 (talk) 12:06, 15 October 2022 (UTC)[reply]
Dear NordNordWest, Could I ask you to help make maps of ranges for several species of shrews? Maps of their distribution, which are available on Wikipedia, are very outdated. If you agree, I could send you the necessary links to the source materials. If you do not have time, I would be very grateful if you could teach me how to make cards. Sincerely Hunu (talk) 11:28, 17 October 2022 (UTC)[reply]
Hello! You can list all species which lack a map and sources for their distribution. I could create the maps bit by bit. Best regards, NNW11:35, 17 October 2022 (UTC)[reply]
Thank you. The main source is [5]. Maps after page 369.
Thank you for "Range of Crocidura shantungensis" . Yes this is quite different from the IUCN map? because IUCN map is completely wrong. Unfortunately, I know that very well. What do you think about
Sorex portenkoi P. 373, Map V, ж - Sorex jacksoni (only Sibirian part without Alaska)
Crocidura shantungensis P. 382 e - northern border of the range. ???
Hallo NNW, auf der Karte zu den Erststimmenmehrheiten bei der Landtagswahl 2022 in Niedersachsen ist der Wahlkreis Neustadt/Wunstorf noch falsch eingefärbt. Er wurde von der SPD gewonnen und nicht von der CDU. Das müsste noch korrigiert werden. Danke und viele Grüße Bernsteinkater (talk) 21:27, 28 October 2022 (UTC)[reply]
Hello NNW, would you mind creating a bunch of maps of each of the emirates of the UAE please? I struggle to find a detailed map for each of them and having at least one would be great. Badass Flare (talk) 18:07, 31 October 2022 (UTC)[reply]
And Ajman and Fujairah's boundaries are both separated by exclaves so you don't need to draw much boundaries in them. The real issues were Umm Al Quwain and Ras Al Khaimah, both had no maps but after checking Open Street View, I have determined that UAQ only has two and RAK has seven. Anyways if you can't outline an Emirate's subdivisions, that's okay, just a good map of the Emirate is fine in my book. Badass Flare (talk) 20:16, 1 November 2022 (UTC)[reply]
When it comes to books, I found one in google books but they aren't any ebooks available for it, but as I said before, emirates like Ajman and Fujairah are separated via exclaves already so you don't need to draw additional boundaries for them. 10:22, 2 November 2022 (UTC) Badass Flare (talk) 10:22, 2 November 2022 (UTC)[reply]
Well these maps are required in the Wikipedia articles relating to those regions as it would be much better to use an outline map of the emirate to point out local communities and suburbs. If official government maps aren't suitable for you then I would like an example of what type of maps you need. Badass Flare (talk) 12:52, 2 November 2022 (UTC)[reply]
Die Karte der DFB-Pokalsieger ist nicht mehr aktuell; der Eintrag für RB Leipzig im Jahe 2022 fehlt.
Könnte man das vielleicht ergänzen? UNLE2014 (talk) 14:37, 5 November 2022 (UTC)[reply]
Na klar und danke für den Hinweis. Ich habe nicht alle Karten, die ich je gemacht habe, auf dem Schirm, da rutscht sowas gerne durch. NNW16:50, 5 November 2022 (UTC)[reply]
Hello! I updated some of them. For the other files please contact the original creators, they are still active and can do it for their files. NNW17:08, 11 December 2022 (UTC)[reply]
Hello. Thank you for your exemplary work on the creation on maps. Lately I have gained some interest in locations in Kenya. I would love to create some maps in .svg format. However, I don't really know where to start. Do you have any site where I can learn the skills. Some areas in Kenya especially Nairobi are in need of maps. Cheers! Tylusine (talk) 14:02, 10 December 2022 (UTC)[reply]
Hello! You need to work with a vector graphics program like Inkscape, CorelDraw or Adobe Illustrator. Inkscape is free but I cannot give you a tutorial because I do not work with Inkscape. NNW16:39, 11 December 2022 (UTC)[reply]
Knowing Inkscape is a very good start. Next step would be a download of OpenStreetMap data (I prefer PDF instead of SVG). You open that file in Inkscape and delete everything you don't want to have. You can resize, recolour, label as you like. The main advantage with Kenya: you don't have to think about map projections when using OSM data. Just have a try! NNW15:59, 12 December 2022 (UTC)[reply]
Although the problem I have realised with OpenStreetMap, the boundaries of the counties are not entirely correct. Especially the Nairobi area boundary. Tylusine (talk) 20:55, 14 December 2022 (UTC)[reply]
Working with a vector graphics file means it is easy to change and correct a map. Delete the wrong parts, redraw it correctly: make a screenshot of a correct map with the Nairobi boundary, fit it into your file and draw the line. NNW15:20, 18 December 2022 (UTC)[reply]
Hello NNW. Is it possible that you create maps for remaining Croatian counties in the nearest future? If not, could you please help me with addressing such a request to someone else, e.g. to map project group? Greetings, Mathieu Mars (talk) 14:14, 18 December 2022 (UTC)[reply]
I have to prepare the changes that will come with the new year, so this is a bad time to create 20 maps in a short time. I don‘t know if there is somebody who is willing to do such a job. Most mapmakers seem to have left Wikipedia/Commons and the remaining are quite busy. NNW15:23, 18 December 2022 (UTC)[reply]
I fear this is a mistake in the original data where the islands are located inaccurately. I think I have to re-create that location map with OSM data. NNW11:04, 22 December 2022 (UTC)[reply]
Hello @NordNordWest I have taken an attempt at making a map of the Inner Oslofjord in the location map scheme. I was wondering if you could take a look at it and check if the style is correct (fonts, colors, border size, etc.) and if you have time see if there is anything that you perhaps could make more aesthetically pleasing or simplfy the SVG. For example I wasn't sure how to make the borders of the different bodies of water a different color than blue since they are a part of the same object so I just drew some rough lines on top of the other lines.
Hello! I just had a quick look at your file. First of all it looks fine although I don't understand why Bekkelagsbassenget and Bunnebotn are in box, Bærumsbassenget and Holmenfjorden not. The islands are all duplicated which isn't necessary as all water polygons have holes for them. So you could delete them (reduces file size). To show the borders of the waterbodies in a different colour you do have to redraw them (or duplicate the polygons and delete all nodes that you don't need -> same result). You could merge all waterbodies after drawing the borders then you have less polygons. This reduces the file a bit but not much in such a small map. In bigger maps it might be a gain but on the other hand the polygon might get quite complicated. It's your decision what you prefer. As Mediawiki has got some problems to show text correctly some editors started to work with a trick: they duplicate the text layer, hide the first one and convert the text to contours in the second one. So Mediawiki is forced to show the text as a graphic element and every re-user still has got editable text elements. Disadvantage: the file gets a bit more complicated and bigger. Regards, NNW15:46, 1 January 2023 (UTC)[reply]


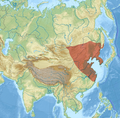 Crocidura shantungensis
.svg)