Commons:Featured picture candidates/File:Composition of the German Bundesrat as a pie chart.svg
Jump to navigation
Jump to search

File:Composition of the German Bundesrat as a pie chart.svg, not featured[edit]
Voting period is over. Please don't add any new votes.Voting period ends on 20 Aug 2022 at 20:15:16 (UTC)
Visit the nomination page to add or modify image notes.

- Gallery: Commons:Featured pictures/Non-photographic media/Others
 Info created by Aeroid - uploaded by Aeroid - nominated by Aeroid -- Aeroid (talk) 20:15, 11 August 2022 (UTC)
 Support -- Aeroid (talk) 20:15, 11 August 2022 (UTC)
 Abstain As I do not know the FP protocol for graphics. Urban Versis 32KB ⚡ (talk | contribs) 22:21, 11 August 2022 (UTC)
 Question looks very nice at first sight, but gets really confusing once I try to wrap my head around it. What exactly does the area size encode? Is it really the number of seats per party? That doesn't seem to add up. For instance, afaict SPD in Saxony and Linke in Bremen each cannot have more than one seat (they are the weakest of three parties in their state and the states have only 4 and 3 grey rectangles aka seats respectively). So why is the area for SPD in Saxony larger than the area of Linke in Bremen? In other places, I can't even make out which area is larger: Grüne in Bremen or Linke in Berlin? Luckily this is based on an official figure so I don't feel bad about being blunt: Regular pie charts are already bad enough in that regard, but this is almost completely obscure to me. At the very least it needs a much better description. --El Grafo (talk) 08:11, 12 August 2022 (UTC) PS @Aeroid Let me know if I'm somehow missing the point here. Also be aware that it's entirely fine to make adjustments to both the file and the description during the nomination as long as you notify people here.
- Turns out I indeed completely missed the point. Apparently, seats from one state are not divided between the parties in a coalition after all. The area representing a party within a state's slice of pie (or donut) is not equivalent to anything. It just depends on the number of seats available (angle) and number of parties in the coalition (number of subdivisions in a slice). This is just a ridiculously convoluted and unintuitive way of transmitting the same information as in File:Bundesrat Sitzverteilung.svg. A great example of design decisions getting in the way of delivering the message. Obviously not Aeroid's fault, who afaict did a great job with the manual SVG. Sorry, but I can only
 Oppose this for being unclear and potentially even misleading. --El Grafo (talk) 10:03, 12 August 2022 (UTC)
- It's not a standard election diagram. It illustrates a rather custom German constitutal body with its particular details of composition and voting procedures.
- But thanks for digging into it and trying to get your head around it. I also did the other diagram you mentioned, which I abandoned due to information of the actual current division of power was encoded on the physical seats. That didn't work on thumbs.
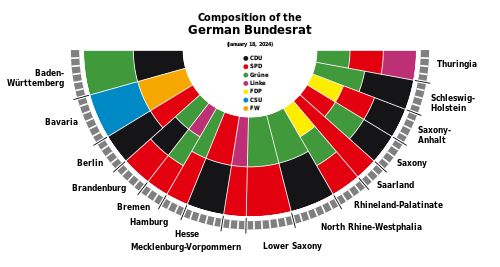
- Just to explain a little bit this choice here: a "slice" is a state, each state has defined number of seats by constitution. The seats are the outer circle grey boxes. This defines the "width" (angle) of the slice.
- A state is ruled by single parties (Saarland) or most commonly coalitions. There are typcially majority parties "leading" teh coalition and get their candidate elected to be the state's head of legislature (Ministerpresident). This majority party is one the outermost position in the slice, taking up most of the "area". the smallest coalition member is on the innermost postion of the slice. For me this is enough info and as much as you could encode. The election results leading to this coaltion are not really relevant after the coalition takes power and divides ministers among them as they decide. The seats here and voting procedure are by law bound together and a stae has to vote as one with all their seats. So I think it well represents this kind of political body. The offical charts on the Bundesrat.de website are very similar, so didn't really invent soemthing new.
- There is a second very similar diagram style the I maintain and can update within 2 minutes which is suitable for even smaller thumbnails.
- As mentioned really not much of an "design", I re-use color choices from the election diagrams on wikide and just put quite some work on easy translation and update capabilities of this.
- But thanks for your feedback, if more people don't get the content (which is complex, can't change german law), I'm happy to consider incorporating it in a further variant. Aeroid (talk) 16:40, 12 August 2022 (UTC)
- Turns out I indeed completely missed the point. Apparently, seats from one state are not divided between the parties in a coalition after all. The area representing a party within a state's slice of pie (or donut) is not equivalent to anything. It just depends on the number of seats available (angle) and number of parties in the coalition (number of subdivisions in a slice). This is just a ridiculously convoluted and unintuitive way of transmitting the same information as in File:Bundesrat Sitzverteilung.svg. A great example of design decisions getting in the way of delivering the message. Obviously not Aeroid's fault, who afaict did a great job with the manual SVG. Sorry, but I can only
- So I actually got it right the second time - yay! After some consideration, I think my main problem with understanding the chart was that it looks very much like a stacked bar chart of one thing (probably proportions of 100%) merged with a half doughnut chart of another thing. Figuring out what the doughnut part means was relatively easy. But figuring out that the stacked bar chart is not a bar chart at all took a while. I'm not saying that bar length should encode more information, but it could, and at first sight it looks like it does. That's what I meant with misleading above. There's of course nothing wrong with doing it like this (after all, it's pretty much identical the one on the Bundesrat website), and being useful at thumb size is a valid concern (at least for Wikipedia, not so much over here). This edit already helps a lot!
- Contents aside, I'd like to say that this indeed a high-quality figure with good proportions, line weights, etc. (the only thing I would personally change is the yellow, as it's visually close to white and the circle in the legend next to FDP is barely visible on my (cheap but calibrated) screen). So if you're not succeeding here, that's not because you didn't do a good job (wow, triple negative ...). It's just that FP at Commons aims for media that has at least a bit of a wow-effect, and that's really difficult to achieve with any kind of diagram. --El Grafo (talk) 08:54, 15 August 2022 (UTC)
- Thanks for the kind words. It was a shot in the dark. If I knew that a "Visual Wow-factor" was the prime hurdle to take, I wouldn't have tried it. Would be great if this could be clarified on the entry page. While there are of course great illustrations that could qualfiy, I would question the "visual" focus. Especially as we are nowadays facing lower entry barriers for "good looking content" (which is good), but need not to forget, that pure visuals are not the sole quality-criteria (not even to start any DALL-E discussion here). But I understand that the "maintainability" is probably hard to fit into the "FP protocol". Aeroid (talk) 11:35, 16 August 2022 (UTC)
- To clarify, the "wow" does not have to be visual at all. Can be "wow, this is educational", "wow, this is a rare sight" or basically anything else. Technically speaking, it's not even a rule, more of an observation of voting behavior: candidates that have a certain something about them that is somehow outstanding/special/impressive/better that "just good" tend to be the ones that are successful. But yeah, maybe we have reached a point where it has turned into an unwritten rule, that should be written down somewhere. El Grafo (talk) 12:37, 16 August 2022 (UTC)
- Thanks for the kind words. It was a shot in the dark. If I knew that a "Visual Wow-factor" was the prime hurdle to take, I wouldn't have tried it. Would be great if this could be clarified on the entry page. While there are of course great illustrations that could qualfiy, I would question the "visual" focus. Especially as we are nowadays facing lower entry barriers for "good looking content" (which is good), but need not to forget, that pure visuals are not the sole quality-criteria (not even to start any DALL-E discussion here). But I understand that the "maintainability" is probably hard to fit into the "FP protocol". Aeroid (talk) 11:35, 16 August 2022 (UTC)
- Oppose Very simple image. --Wilfredor (talk) 19:05, 12 August 2022 (UTC)
- Thanks for your feedback, I take that as a compliment. I didn't see a need for any fancyness. I hope you have also considered the SVG code for easy updating and the 17 translations. Aeroid (talk) 20:31, 12 August 2022 (UTC)
- Oppose I don't see what separates this one from all the other semicircular distribution charts we have of seating and representation in legislative bodies around the world. And it is necessarily subject to change. Daniel Case (talk) 02:56, 13 August 2022 (UTC)
- SVG maintainability for additional languages and frequent updates. In other words... all (but one) other diagrams on this are out of date. ;-) Aeroid (talk) 11:37, 16 August 2022 (UTC)
- Oppose No wow and per Daniel. --SHB2000 (talk) 02:00, 14 August 2022 (UTC)
Confirmed results:
Result: 1 support, 3 oppose, 0 neutral → not featured. /--A.Savin 20:58, 17 August 2022 (UTC)