Category:Wind diagrams
Jump to navigation
Jump to search
Subcategories
This category has the following 21 subcategories, out of 21 total.
A
C
- Wind chill (19 F)
D
F
- Foehn wind diagrams (26 F)
G
- Geostrophic wind diagrams (12 F)
J
- Jet streams (43 F)
K
- Katabatic wind diagrams (19 F)
M
- Microburst diagrams (19 F)
- Modelling wind field (9 F)
- Monin–Obukhov length (2 F)
R
S
- Slope and valley winds (8 F)
- Wind speed symbols (105 F)
T
- Thermal wind (13 F)
W
- Walker circulation (28 F)
- Windward and leeward (6 F)
Media in category "Wind diagrams"
The following 101 files are in this category, out of 101 total.
-
 111-SC-1662 - Chemical warfare - Charts - NARA - 55164673.jpg 9,178 × 6,297; 17.84 MB
-

-
 2013 POCASIHL.png 2,889 × 3,289; 455 KB
-
 2013 Počasí Hroznová Lhota.svg 1,800 × 2,000; 196 KB
-
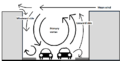 A wind vortex inside a street canyon.png 767 × 387; 26 KB
-
 A wind votex inside a street canyon.png 483 × 334; 4 KB
-
 Abwind.jpg 406 × 262; 22 KB
-
 Abwind.svg 541 × 349; 9 KB
-
 Action du vent sur un lac.png 569 × 309; 5 KB
-
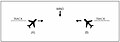 Aim fig 4-1-1 induced error in position of traffic.jpg 466 × 163; 6 KB
-
 Aim fig 4-1-2 induced error in position of traffic.jpg 464 × 196; 6 KB
-
 Airflow propeller BET.svg 828 × 590; 64 KB
-
 Allure.jpg 2,000 × 1,000; 168 KB
-
 Apparent Wind.png 308 × 510; 23 KB
-
 ApparentWind.svg 400 × 600; 27 KB
-
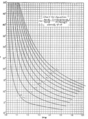 Chart for equation BET.png 595 × 806; 694 KB
-
 Chart for sollution of O BET.png 644 × 809; 538 KB
-
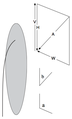
 Convex lower chamber BET.svg 460 × 300; 33 KB
-
 Corrientes ecuatoriales del Pacífico.png 2,036 × 696; 103 KB
-
 Cyclostrophic wind.png 600 × 600; 20 KB
-
 De Bilt 2014-12-04 12UTC.png 1,079 × 903; 393 KB
-
 Denmark Wind and Solar Generation Percentage-semilog.svg 800 × 600; 13 KB
-
 Denmark Wind Generation Histogram-2015.svg 800 × 600; 7 KB
-
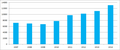 Denmark wind power generation by year.png 717 × 300; 10 KB
-
 Downwash corrections e BET.png 644 × 933; 405 KB
-
 EB1911 - Lake currents.jpg 508 × 110; 27 KB
-
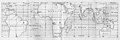 Edmond Halley's map of the trade winds, 1686.jpg 3,323 × 1,103; 2.31 MB
-
 Elementary physical geography; (1908) (14804390553).jpg 2,480 × 1,592; 817 KB
-
 FAA-8083-13 Fig 7-20.PNG 733 × 295; 29 KB
-
 Fale illustracje1a.jpg 1,200 × 895; 245 KB
-
 Fallwinde.png 500 × 250; 122 KB
-
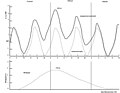
 Fluctuations in hourly wind velocities.jpg 432 × 318; 14 KB
-
 FMIB 43931 Storm in the Pyrenees (after Lartigue).jpeg 753 × 822; 104 KB
-
 Fusée au décollage par vent fort.gif 758 × 436; 3.4 MB
-
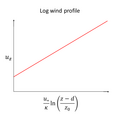 General log wind profile (large text).png 719 × 719; 22 KB
-
 General log wind profile.png 899 × 719; 23 KB
-
 Horizontal velocities of a wind profiler.gif 800 × 600; 475 KB
-
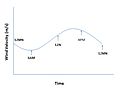
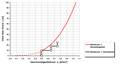
 Hydrogen Fraction Vs Excess Wind Levels.jpg 1,241 × 933; 106 KB
-
 Innertropische Konvergenzzone.jpg 429 × 167; 26 KB
-
 Integral-tree.svg 744 × 1,052; 70 KB
-
 ITC.png 1,096 × 374; 10 KB
-
 Jetsteam bodenkarte nordhalbkugel.png 696 × 399; 111 KB
-
 Kou-en-warmtefront.png 800 × 463; 108 KB
-
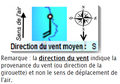 La direction du vent indique la provenance du vent.png 314 × 219; 48 KB
-
 Lift corrections 8Cl BET.png 861 × 942; 503 KB
-
 Map local winds.png 1,425 × 625; 76 KB
-
 Map prevailing winds on earth.png 1,425 × 625; 157 KB
-
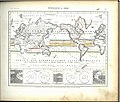
 Maury plate 01.jpg 2,723 × 2,947; 2.91 MB
-
 Meyer‘s Zeitungsatlas 089 – Windkarte der Erde.jpg 7,393 × 6,258; 10.94 MB
-
 MjerenjaPozega20210625-zapad.png 876 × 570; 38 KB
-
 Moll - A view of ye general and coasting trade winds.png 1,800 × 678; 790 KB
-
 Nasa wind vs alt curves.JPG 504 × 763; 54 KB
-
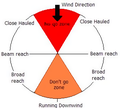 Point of sail.png 298 × 269; 52 KB
-
 Position of blade pitat BET.svg 717 × 711; 42 KB
-
 Propeller airfoil characteristics BET.png 630 × 743; 498 KB
-
 Propeller RAF-6 12345.png 590 × 829; 622 KB
-
 PSM V18 D373 Wind velocity chart of a typhoon.jpg 1,456 × 1,773; 194 KB
-
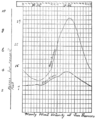 PSM V59 D547 Hourly wind velocity at san francisco.png 1,032 × 1,258; 223 KB
-
 PSM V60 D505 Chart of the eastward movement of upper air above washington dc.png 825 × 1,042; 131 KB
-
 PSM V60 D509 Wind direction and velocity at various heights.png 841 × 1,091; 73 KB
-
 Rotation horizontale avec changement de vent.png 634 × 472; 16 KB
-
 Rotation horizontale.png 513 × 319; 7 KB
-
 Savonius Rotor Şema (Türkçe).png 660 × 600; 62 KB
-
 ScheinbarerWind3.svg 400 × 600; 27 KB
-
 Schéma anémomètre 2d.svg 594 × 513; 11 KB
-
 Schéma anémomètre 3d.svg 500 × 513; 14 KB
-
 Siberian cold.png 1,231 × 929; 68 KB
-
 SpectreVanDerHoven.png 2,266 × 1,049; 122 KB
-
 Szélrózsa.png 415 × 448; 87 KB
-
 Tabula Anemographica seu Pyxis Nautica, vulgo Compass Charte.jpg 14,456 × 12,518; 51.24 MB
-
 Thrust grading curves BET.svg 657 × 437; 73 KB
-
 Transportation by wind.jpg 598 × 179; 47 KB
-
 Variation of wind velocity with altitude.jpg 313 × 245; 8 KB
-
 Vent-apparent.png 354 × 266; 5 KB
-
 Verticaal Windrichtingprofiel De Bilt 2014-10-06 00 UTC.svg 439 × 726; 34 KB
-
 Viento del gradiente.jpg 588 × 591; 27 KB
-
 Vientos alisios.png 1,600 × 1,436; 1.95 MB
-
 Vientos contralisios.png 1,600 × 1,418; 1.95 MB
-
 Vientos del oeste.jpg 1,260 × 948; 138 KB
-
 Vientos polares.png 1,600 × 1,436; 1.94 MB
-
 Wavegenerp.jpg 387 × 319; 25 KB
-
 Wiatr zboczowy.JPG 618 × 419; 16 KB
-
 Wind blow 3016.jpg 335 × 142; 16 KB
-
 Wind component indicator.jpg 450 × 368; 93 KB
-
 Wind drift.png 684 × 1,000; 26 KB
-
 Wind Formation.JPG 478 × 177; 8 KB
-
 Wind Formation.svg 720 × 500; 2 KB
-
 Wind in Denmark 1977 2009 large.gif 1,000 × 600; 35 KB
-
 Wind in Denmark 1977 2009.gif 500 × 300; 14 KB
-
 Wind in Denmark 1977 2009.svg 511 × 305; 141 KB
-
 Wind rose matelica 2009-2010.png 1,200 × 900; 18 KB
-
 Wind rose matelica 2009-2011.png 1,200 × 900; 22 KB
-
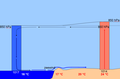
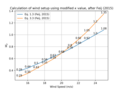 Wind setup graph.png 1,920 × 1,440; 169 KB
-
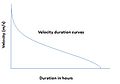 Wind velocity duration curves.jpg 425 × 296; 15 KB
-
 Winde.png 703 × 393; 90 KB
-
 Windopzet Vlissingen 1953.jpg 800 × 620; 57 KB
-
 Windprofil1.png 2,440 × 1,324; 68 KB
-
 Wing 2 BET.svg 564 × 279; 35 KB
-
 Zeewind.png 958 × 633; 1.74 MB
-
 Zonalerwind.jpg 900 × 620; 361 KB
-
 地上風の向き.svg 200 × 200; 45 KB


_(14804390553).jpg)


.jpeg)

.png)


.png)


