Category:Charts showing data through 2012
Jump to navigation
Jump to search
Deutsch: Statistiken bis zu und einschließlich 2012. Viele Grafiken fehlen hier noch – bitte hinzufügen.
English: Charts showing data up to and including 2012.
- Many charts are still missing – please help categorizing charts, e.g. from here. Outdated charts can often be updated. Only charts on notable subjects with specified data source(s) should be included.
Media in category "Charts showing data through 2012"
The following 8 files are in this category, out of 8 total.
-

-
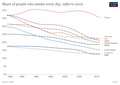 Daily-smoking-prevalence.png 3,400 × 2,400; 479 KB
-
 Global Living Planet Index,1970-2012.svg 850 × 600; 25 KB
-

-
 Number of national elections held per year, OWID.svg 850 × 600; 8 KB
-
 Sr-Ca temperature records from Caribbean sclerosponges.webp 1,068 × 1,066; 139 KB
-
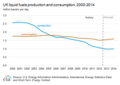 UK oil production-consumption.png 610 × 430; 23 KB
-
 World Oil Production.png 2,000 × 1,350; 28 KB


