Category:Seafood statistics
Jump to navigation
Jump to search
Statistics about seafood, aquaculture and fishing
Subcategories
This category has the following 2 subcategories, out of 2 total.
A
- Aquaculture charts (23 F)
W
- Whaling statistics (20 F)
Media in category "Seafood statistics"
The following 76 files are in this category, out of 76 total.
-
 -1 verk.1 - veiðiþjóðir.png 942 × 359; 15 KB
-
 Afli leturhumars 1992-2013.jpg 615 × 393; 18 KB
-
 Afli villtra og ræktaðra skelja.jpg 529 × 308; 36 KB
-

-
 Annual-fish-catch-taxa (OWID 0043).png 850 × 600; 106 KB
-
 Biomass-fish-stocks-region (OWID 0078).png 850 × 600; 81 KB
-
 Biomass-fish-stocks-taxa (OWID 0140).png 850 × 600; 62 KB
-
 Bottom-trawling (OWID 0138).png 850 × 600; 104 KB
-
 Capture fishery production, OWID.svg 850 × 600; 22 KB
-
 Capture-and-aquaculture-production (OWID 0132).png 850 × 600; 60 KB
-
 Capture-fisheries-vs-aquaculture (OWID 0131).png 850 × 600; 67 KB
-
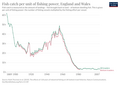 Catch-fishing-power-uk (OWID 0117).png 850 × 600; 75 KB
-
 Change-marine-mammals (OWID 0158).png 850 × 600; 66 KB
-
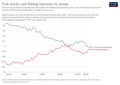
 Chart of Peru fish catch 1960-2021.png 983 × 631; 49 KB
-
 Cheung 2023 fishery projections.png 899 × 1,201; 402 KB
-
 Effondrement niveaux trophiques.jpg 1,245 × 863; 203 KB
-
 Employed-fisheries-aquaculture (OWID 0368).png 850 × 600; 49 KB
-
 Employed-fisheries-aquaculture-time (OWID 0369).png 850 × 600; 42 KB
-
 Fish and seafood consumption per capita, OWID.svg 850 × 600; 141 KB
-
 Fish and seafood consumption vs. GDP per capita, OWID.svg 850 × 600; 33 KB
-
 Fish-and-seafood-consumption-per-capita-historical.svg 850 × 600; 69 KB
-
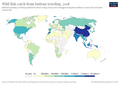
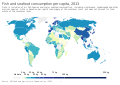
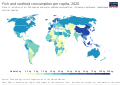 Fish-and-seafood-consumption-per-capita-map.svg 850 × 600; 166 KB
-
 Fish-catch-gear-type (OWID 0440).png 850 × 600; 89 KB
-
 Fish-catch-region (OWID 0441).png 850 × 600; 96 KB
-
 Fish-catch-sector-bar (OWID 0438).png 850 × 600; 55 KB
-
 Fish-catch-uk (OWID 0439).png 850 × 600; 90 KB
-
 Fish-consumption-vs-gdp-per-capita (OWID 0437).png 850 × 600; 105 KB
-
 Fish-discard-rates-gear (OWID 0436).png 850 × 600; 71 KB
-
 Fish-discards (OWID 0433).png 850 × 600; 55 KB
-
 Fish-discards-gear (OWID 0435).png 850 × 600; 55 KB
-
 Fish-landings-and-discards (OWID 0434).png 850 × 600; 63 KB
-
 Fish-seafood-production (OWID 0432).png 850 × 600; 100 KB
-
 Fish-stocks-by-region (OWID 0431).png 850 × 600; 81 KB
-
 Fish-stocks-taxa (OWID 0426).png 850 × 600; 78 KB
-
 Fish-stocks-within-sustainable-levels (OWID 0429).png 850 × 600; 58 KB
-
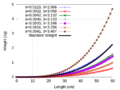 FishBaseLWRCCatfish.png 1,280 × 960; 31 KB
-
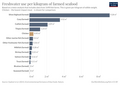
 Fisheryexpenditure2004.png 594 × 375; 13 KB
-
 Fishing-methods.png 1,746 × 2,590; 950 KB
-
 Fishing-pressure-by-region (OWID 0427).png 850 × 600; 88 KB
-
 Fishing-pressure-by-taxa (OWID 0428).png 850 × 600; 85 KB
-
 Freshwater-use-seafood (OWID 0391).png 850 × 600; 67 KB
-
 Ghg-emissions-seafood.svg 850 × 600; 37 KB
-
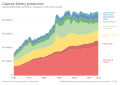
 Global capture fishery production, OWID.svg 850 × 600; 7 KB
-
 Global wild fishery catch by sector, OWID.svg 850 × 600; 20 KB
-
 Global-aquaculture-wild-fish-feed (OWID 0470).png 850 × 600; 77 KB
-
 Global-marine-protected-area (OWID 0538).png 850 × 600; 52 KB
-
 Land-use-seafood (OWID 0582).png 850 × 600; 75 KB
-
 Marine-protected-areas (OWID 0551).png 850 × 600; 103 KB
-
 National mean intake of seafood (A) and egg (B) in 2018, all ages.jpg 4,176 × 3,774; 1.52 MB
-
 Nitrogen-emissions-seafood (OWID 0627).png 850 × 600; 74 KB
-

-
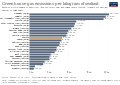
 Pesca per stato membro dell'Unione europea nel 2017.svg 600 × 550; 34 KB
-
 Protection-of-the-rights-of-small-scale-fisheries (OWID 0884).png 850 × 600; 102 KB
-
 Protection-of-the-rights-of-small-scale-fisheries.png 3,400 × 2,400; 843 KB
-
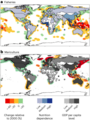
 Regulation-illegal-fishing (OWID 0869).png 850 × 600; 108 KB
-
 Regulation-illegal-fishing-map.png 3,400 × 2,400; 819 KB
-
 Regulation-illegal-fishing.png 3,400 × 2,400; 386 KB
-
 Seafood and fish production, OWID.svg 850 × 600; 20 KB
-
 Seafood production- wild fish catch vs aquaculture, 1, OWID.svg 850 × 600; 8 KB
-
 Seafood production- wild fish catch vs aquaculture, OWID.svg 850 × 600; 10 KB
-
 Seafood-and-fish-production-thousand-tonnes (OWID 0950).png 850 × 600; 74 KB
-
 Share of global fish stocks that are not overexploited, OWID.svg 850 × 600; 5 KB
-
 Share-of-fish-stocks-overexploited (OWID 0995).png 850 × 600; 82 KB
-
 Share-of-fish-stocks-that-are-sustainably-fished.png 3,400 × 2,400; 856 KB
-
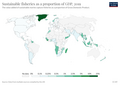 Sustainable-fisheries-as-a-proportion-of-gdp (OWID 1059).png 850 × 600; 94 KB
-
 Sustainable-fisheries-as-a-proportion-of-gdp-map.png 3,400 × 2,400; 826 KB
-
 Sustainable-fisheries-as-a-proportion-of-gdp.png 3,400 × 2,400; 357 KB
-
 Sútrakrabbi afli veiddur 1950-2014 .png 947 × 616; 70 KB
-
 Tafla - veiðar BNA.png 1,132 × 652; 37 KB
-

-
 Trawling-footprint-region (OWID 1134).png 850 × 600; 102 KB
-
 Whale-catch (OWID 1109).png 850 × 600; 108 KB
-
 Whales-killed-per-decade (OWID 1106).png 850 × 600; 50 KB
-
 Wild-fish-allocation (OWID 1103).png 850 × 600; 56 KB
-
 Wild-fish-catch-gear-type.svg 850 × 600; 49 KB
-
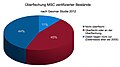 Überfischte Bestände MSC zertifiziert.jpg 694 × 390; 29 KB


,_capture_production,_million_tonnes,_1950-2022.svg)
.png)
.png)
.png)
.png)

.png)
.png)
.png)
.png)


.png)
.png)


.png)
.png)
.png)
.png)
.png)
.png)
.png)
.png)
.png)
.png)
.png)
.png)
.png)


.png)
.png)
.png)


.png)
.png)
.png)
.png)
_and_egg_(B)_in_2018,_all_ages.jpg)
.png)


.png)

.png)


.png)

.png)

.png)


.png)
.png)
.png)
.png)
.png)

