Category:Aquaculture charts
Jump to navigation
Jump to search
Media in category "Aquaculture charts"
The following 23 files are in this category, out of 23 total.
-

-
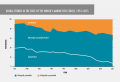
 Contribution of fish to animal protein supply, average 2013-2015.svg 512 × 423; 168 KB
-
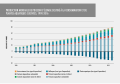
 Global capture fisheries and aquaculture production, 1990-2030.svg 512 × 336; 55 KB
-
-
 Global-aquaculture-wild-fish-feed (OWID 0470).png 850 × 600; 77 KB
-
-

-
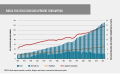
 Phosphorous-emissions-seafood (OWID 0849).png 850 × 600; 74 KB
-

-

-
 Producción mundial de la pesca de captura y la acuicultura.svg 512 × 310; 70 KB
-
 Production halieutique et aquacole mondiale, de 1990 à 2030.svg 512 × 341; 54 KB
-
 Production halieutique et aquacole mondiale.svg 512 × 310; 73 KB
-
-

-
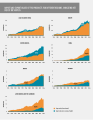
 Utilisation et consommation apparente de poisson dans le monde.svg 512 × 303; 110 KB
-
 Utilización y consumo aparente de pescado a nivel mundial.svg 512 × 318; 99 KB
-

-

-

-
 World capture fisheries and aquaculture production.svg 512 × 309; 63 KB
-
 World fish utilization and apparent consumption.svg 512 × 313; 88 KB
-


.png)

.svg)
.png)


