Category:Maps of subdivisions of England
Jump to navigation
Jump to search
| NO WIKIDATA ID FOUND! Search for Maps of subdivisions of England on Wikidata | |
| Upload media |
English: ; The local government system in England ranges from nine main regions:with subordinate County level divisions districts to non-metropolitan districts (local government districts) with unitary authority status; Non-metropolitan districts, or colloquially 'shire districts', are a type of local government district in England. As originally created, they are sub-divisions of non-metropolitan counties (colloquially shire counties) in a so-called "two-tier" arrangement. By contrast Metropolitan districts (a type of unitary authority) are county level governments which also take on the responsibilities for all local government functions within its area.
- Because of the inconsistency in it's organization, this category is being made the root of all subnational Maps of England.

Subcategories
This category has the following 7 subcategories, out of 7 total.
*
C
D
R
U
Media in category "Maps of subdivisions of England"
The following 75 files are in this category, out of 75 total.
-
 Area Gas Boards.PNG 375 × 569; 15 KB
-
 BlankMap-EnglandSubdivisions.png 2,165 × 2,670; 124 KB
-
 BlankMap-EnglandSubdivisions2009.png 2,165 × 2,670; 114 KB
-
 Ceremonial Counties of England.png 459 × 560; 159 KB
-
 Combined authorities in England map, 2021.svg 1,152 × 1,152; 8.62 MB
-
 Combined authorities in the UK.svg 247 × 461; 7.82 MB
-
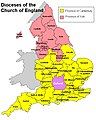
 Dioceses of the CofE.png 557 × 697; 28 KB
-
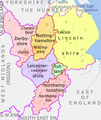 East Midlands counties 00.png 1,723 × 2,047; 295 KB
-
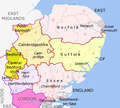 East of England Counties.png 1,593 × 1,440; 1.06 MB
-
 England Administrative 1931 Unlabelled.png 21,000 × 26,010; 8.12 MB
-
 England Administrative 1931.jpg 5,300 × 6,512; 3.07 MB
-
 England Administrative 1931.tif 5,300 × 6,512; 10.99 MB
-
 England Administrative Map 1971.png 5,300 × 6,512; 7.64 MB
-
 England Adminstrative 2010 Blank.png 3,000 × 3,771; 1.56 MB
-
 England as proposed cambs problem.jpg 2,165 × 2,670; 529 KB
-
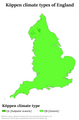 England by Köppen type.png 5,700 × 8,638; 311 KB
-
 England Clinical Commissioning Group (CCG) Map (Labelled).svg 744 × 1,007; 49.99 MB
-
 England Clinical Commissioning Group (CCG) Map.svg 744 × 1,007; 46.64 MB
-
 England County Boroughs 1974.png 2,625 × 3,256; 1.12 MB
-
 England map it.png 448 × 515; 12 KB
-
 England RedcliffeMaud Provinces.png 200 × 244; 16 KB
-
 England RedcliffeMaud.png 400 × 487; 76 KB
-
 EnglandCountyBoroughs.png 1,500 × 1,828; 122 KB
-
 EnglandEuroParl1999.png 300 × 371; 29 KB
-
 EnglandEuroParl2004.png 300 × 371; 28 KB
-
 EnglandSubdivisions.png 400 × 493; 76 KB
-
 EnglandSubdivisions1986.png 2,165 × 2,670; 116 KB
-
 EnglandSubdivisions1995 new(1).png 2,165 × 2,670; 250 KB
-
 EnglandSubdivisions1995 new(2).png 2,165 × 2,670; 116 KB
-
 EnglandSubdivisions1996.png 2,165 × 2,670; 117 KB
-
 EnglandSubdivisions1997.png 2,165 × 2,670; 120 KB
-
 EnglandSubdivisions1998 new.png 2,165 × 2,670; 129 KB
-
 EnglandSubdivisions1998.png 2,165 × 2,670; 124 KB
-
 EnglandUnitaries 2009.png 500 × 617; 62 KB
-
 English combined authorities.svg 1,108 × 1,345; 326 KB
-
 Geographic footprint of RUCLAD classification England.jpg 1,078 × 1,215; 455 KB
-
 Herefordshire map.png 1,051 × 1,186; 27 KB
-
 Hertfordshire map.png 1,232 × 987; 32 KB
-
 Lancashire map.png 869 × 1,060; 24 KB
-
 Lower-tier local authorities in England map, 2021.svg 1,152 × 1,152; 22.56 MB
-
 North East England counties 2.2.png 842 × 1,100; 70 KB
-
 North West England counties.png 1,341 × 2,685; 306 KB
-
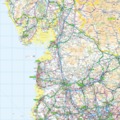
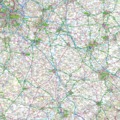
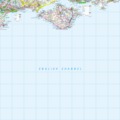
 Ordnance Survey 1-250000 - NY.tif 4,000 × 4,000; 4.05 MB
-
 Ordnance Survey 1-250000 - NZ.tif 4,000 × 4,000; 2.42 MB
-
 Ordnance Survey 1-250000 - OV.tif 4,000 × 4,000; 129 KB
-
 Ordnance Survey 1-250000 - SD.tif 4,000 × 4,000; 3.59 MB
-
 Ordnance Survey 1-250000 - SE.tif 4,000 × 4,000; 3.88 MB
-
 Ordnance Survey 1-250000 - SJ.tif 4,000 × 4,000; 4.41 MB
-
 Ordnance Survey 1-250000 - SK.tif 4,000 × 4,000; 4.25 MB
-
 Ordnance Survey 1-250000 - SO.tif 4,000 × 4,000; 4.9 MB
-
 Ordnance Survey 1-250000 - SP.tif 4,000 × 4,000; 3.92 MB
-
 Ordnance Survey 1-250000 - SS.tif 4,000 × 4,000; 2.22 MB
-
 Ordnance Survey 1-250000 - ST.tif 4,000 × 4,000; 4.04 MB
-
 Ordnance Survey 1-250000 - SU.tif 4,000 × 4,000; 4.15 MB
-
 Ordnance Survey 1-250000 - SV.tif 4,000 × 4,000; 170 KB
-
 Ordnance Survey 1-250000 - SW.tif 4,000 × 4,000; 1.03 MB
-
 Ordnance Survey 1-250000 - SX.tif 4,000 × 4,000; 2.48 MB
-
 Ordnance Survey 1-250000 - SY.tif 4,000 × 4,000; 877 KB
-
 Ordnance Survey 1-250000 - SZ.tif 4,000 × 4,000; 670 KB
-
 Ordnance Survey 1-250000 - TA.tif 4,000 × 4,000; 907 KB
-
 Ordnance Survey 1-250000 - TF.tif 4,000 × 4,000; 2.34 MB
-
 Ordnance Survey 1-250000 - TG.tif 4,000 × 4,000; 936 KB
-
 Ordnance Survey 1-250000 - TL.tif 4,000 × 4,000; 3.42 MB
-
 Ordnance Survey 1-250000 - TM.tif 4,000 × 4,000; 1.44 MB
-
 Ordnance Survey 1-250000 - TQ.tif 4,000 × 4,000; 4.24 MB
-
 Ordnance Survey 1-250000 - TV.tif 4,000 × 4,000; 165 KB
-
 Oxford Diocese.jpg 479 × 599; 97 KB
-
 Redcliffe-Maud Report.png 570 × 706; 153 KB
-
 South East England counties.png 2,554 × 2,000; 428 KB
-
 South East Northumberland Administrative 1931.png 514 × 428; 233 KB
-
 South West England counties.png 1,281 × 936; 258 KB
-
 Thames Estuary OS Map.jpg 1,375 × 1,102; 677 KB
-
 Threetiereducationinengland.png 2,165 × 2,670; 184 KB
-
 West Midlands counties.png 1,160 × 1,306; 166 KB
-
 Yorkshire & The Humber counties.png 1,104 × 940; 169 KB


_Map_(Labelled).svg)
_Map.svg)


.png)
.png)


