Category:Maps of human migrations
Jump to navigation
Jump to search
Subcategories
This category has the following 14 subcategories, out of 14 total.
Media in category "Maps of human migrations"
The following 200 files are in this category, out of 242 total.
(previous page) (next page)-

-
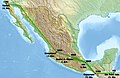 2018-Migrationstreck-Mexico.jpg 2,255 × 1,473; 2.31 MB
-

-

-
 5 historical hakka migrations.svg 512 × 423; 1.66 MB
-
 Acadian deportation map.jpg 1,004 × 661; 136 KB
-
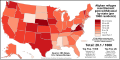 Afghan refugees resettled after 2021 Afghan withdrawal by state.svg 1,199 × 593; 72 KB
-
 African Mitochondrial descent.PNG 387 × 442; 20 KB
-
 Albanians as a migrant Dacian people.png 1,584 × 1,140; 455 KB
-
 Aliyah numbers by country.svg 744 × 387; 2.09 MB
-
 Aliyahnumbersby country.png 2,000 × 1,015; 305 KB
-
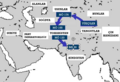
 Ancient migrations of Iranic-speaking populations.PNG 3,000 × 1,826; 3.1 MB
-
 Ancientpeoples.png 1,920 × 1,080; 859 KB
-
 ANE dispertion.jpg 10,604 × 4,536; 51.05 MB
-
 Annual continental migration.gif 320 × 148; 51 KB
-
 Annual Net Migration Rate 2010–2015.svg 2,754 × 1,598; 1.22 MB
-
 Annual Net Migration Rate 2015–2020.svg 2,754 × 1,598; 1.23 MB
-

-
-
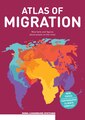 Atlas of Migration 2022.pdf 1,239 × 1,752, 64 pages; 3.88 MB
-
 Ausbreitung des Menschen.png 1,782 × 1,412; 3.94 MB
-
 Baiyue.jpg 600 × 517; 72 KB
-
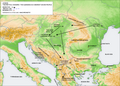
 Balkans 200AD.png 436 × 313; 300 KB
-
 Barbarian invasions from 3rd century.png 1,596 × 920; 791 KB
-
 Bell-Beaker mədəniyyəti(E.ə 2800-1800-cü illər).png 738 × 738; 315 KB
-
 Beringian Standstill and Spread of Native American Founders.png 2,126 × 2,653; 1.98 MB
-
 Bulgarians and Slavs VI-VII century hu.svg 753 × 533; 863 KB
-
 Bulgarians and Slavs VI-VII century.png 2,352 × 1,667; 793 KB
-
 Bulgarians and Slavs VII century pl.png 798 × 585; 572 KB
-
 Bách Việt (Baiyue).jpg 1,772 × 1,341; 1,017 KB
-
 Carte des routes d'immigration africaine vers l'Europe en.svg 729 × 609; 71 KB
-
 Carte des routes d'immigration africaine vers l'Europe es.svg 729 × 609; 71 KB
-
 Carte des routes d'immigration africaine vers l'Europe-mk.svg 729 × 609; 70 KB
-
 Carte des routes d'immigration africaine vers l'Europe-pl.svg 729 × 609; 71 KB
-
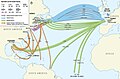
 Carte des routes d'immigration africaine vers l'Europe.svg 729 × 609; 71 KB
-
-
 Central Mediterranean Route-fr.svg 513 × 361; 716 KB
-

-

-
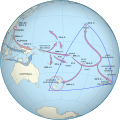
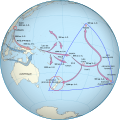
 Chronological dispersal of Austronesian people across the Pacific.svg 1,053 × 425; 2.36 MB
-
 CIE in Italia.svg 1,200 × 1,500; 376 KB
-
 Colonization of the Americas 1750 id.PNG 470 × 623; 17 KB
-
 Colonization of the Americas 1750.PNG 470 × 623; 18 KB
-
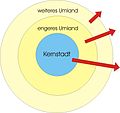
 Counterurbanisierung.jpg 864 × 864; 76 KB
-

-
 Demographics of Liechtenstein.jpg 1,414 × 1,733; 330 KB
-
 Desurbanisierung.jpg 915 × 864; 69 KB
-
 Did Archaic Hominins and Modern Humans Diverge in Circadian Biology?.jpg 3,500 × 2,766; 653 KB
-

-
 Dispersión del haplogrupo P (ADNmt).PNG 909 × 705; 109 KB
-
 Dispertion日本語.jpg 1,798 × 769; 343 KB
-
 Distribution of haplogroup E (YDNA) and migration routes.png 997 × 712; 56 KB
-
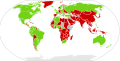 Dual Citizenship 24 jul 2012.svg 853 × 433; 1.26 MB
-
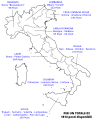
 Emigrazione italiano per regione 1876-1915.svg 1,200 × 645; 376 KB
-
 Europe Prehistory.gif 1,361 × 1,203; 3.03 MB
-
-
 First human migration to New Zealand.svg 800 × 520; 159 KB
-
 First peopling of America.png 602 × 291; 140 KB
-
 Free migration areas.png 1,357 × 628; 37 KB
-
 From Corded Ware to Sintashta日本語.jpg 1,798 × 983; 372 KB
-
 Genomic evidence from Avar period human remains.png 4,287 × 2,041; 19.72 MB
-
 Gerner Tai-Kadai migration route.png 1,000 × 792; 166 KB
-
 Global Compact for Migration UN Assembly vote on 19 December 2018.svg 1,367 × 617; 934 KB
-
 Greats Migration african american's in USA 1910-1970.png 2,048 × 1,150; 744 KB
-
 Guger2.jpg 633 × 343; 76 KB
-
 Guger3.jpg 631 × 304; 60 KB
-
 Hakka migration map (a).svg 512 × 361; 520 KB
-
 Hakka migration map (c).svg 512 × 560; 234 KB
-
-

-
 HgE1b1b1a2.png 1,013 × 758; 171 KB
-
 Hisparevol.gif 470 × 608; 115 KB
-
 Hosted and departing refugees 2015.svg 498 × 360; 850 KB
-
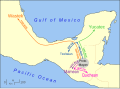
 HUASTECA.png 1,096 × 600; 582 KB
-
 Human geographical dispersion model (Eurasia).jpg 1,280 × 744; 127 KB
-
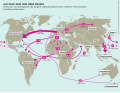
 Human migration routes following Out-of-Africa.png 2,560 × 1,314; 686 KB
-
 Human migration.png 1,264 × 632; 161 KB
-

-

-
 I1a europe.jpg 377 × 415; 200 KB
-
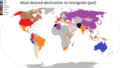 Immigration poll.png 2,752 × 1,552; 152 KB
-
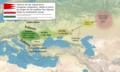
 Immigrations of Yuechies in Central Asia between BCE 176 and CE 30.png 882 × 605; 234 KB
-
 Indo-European expansions1.jpg 2,094 × 1,024; 2 MB
-
 Indo-European migrations and Ancient Northeast Asians.png 6,652 × 2,744; 32.85 MB
-
 Indo-European Migrations.jpg 3,555 × 1,568; 4.32 MB
-

-
 Ireland protestants 1861-1991.gif 601 × 409; 11 KB
-
 Israeli Jewish Emigrants 2010 Pew Map.png 718 × 571; 133 KB
-
 Italian emigration per region 1876-1915.svg 1,200 × 645; 376 KB
-
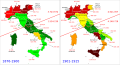 Italienische Emigration pro Region 1876-1915.svg 1,200 × 645; 374 KB
-
 Jalan Migrasi Orang Asal ke Semenjung Tanah Melayu.jpg 1,017 × 689; 96 KB
-
 Journal.pone.0001596.g004.png 996 × 1,651; 953 KB
-
 Jährliche Nettomigrationsrate 2015–2020.svg 2,754 × 1,598; 1.23 MB
-
 Kaart met mondiale prehistorische migraties, waaronder Zuidoost-Azië, KITLV 123104.tiff 2,801 × 1,850; 14.85 MB
-
 Ko-et-al-Map.png 3,495 × 2,462; 1.22 MB
-
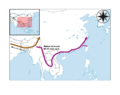
 Kra-And-Li-Migration.png 3,507 × 2,480; 413 KB
-
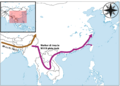
 Kra-Tai-Migration1.png 3,507 × 2,480; 725 KB
-
 Kroatien BV042738218.jpg 7,576 × 5,543; 3.52 MB
-
 Land-use-changes-in-Shandong-province-during-20002008.jpg 600 × 561; 148 KB
-
 Les Valaques.png 920 × 946; 1.05 MB
-
 Map Italy in the world 1989 - Italians abroad in 1930 - Touring Club Italiano CART-TEM-001.jpg 6,220 × 2,699; 11.42 MB
-
 Map Italy in the world 1989 - Italians in the world in 1981 - Touring Club Italiano CART-TEM-001.jpg 12,445 × 5,556; 47.65 MB
-
 Map Italy in the world 1989 - Touring Club Italiano CART-TEM-001.jpg 14,000 × 9,300; 69.91 MB
-
 Map Migration I 1990 - Touring Club Italiano CART-TEM-040.jpg 5,000 × 3,362; 9.47 MB
-
 Map Migration II 1990 - Touring Club Italiano CART-TEM-041.jpg 5,000 × 3,447; 10.62 MB
-
 Map of Indo-European Languages (by Phonology).jpg 1,410 × 823; 522 KB
-
 Map of Ireland in 1609-es.GIF 466 × 582; 10 KB
-
 Map of Ireland in 1609-es.svg 681 × 834; 538 KB
-
 Map of ISEA and generalized migration patterns.png 2,369 × 2,464; 3.98 MB
-
-
 Map of the Ancient Paleo-Siberians.png 5,656 × 2,905; 30.26 MB
-
 Map of the Ancient Paleo-Siberians日本語.jpg 1,798 × 924; 451 KB
-

-
 Map Polynesian migration-es.svg 553 × 553; 946 KB
-
 Map Polynesian migration-fr.svg 553 × 553; 510 KB
-
 Map Romanian Dawns.jpg 2,607 × 2,434; 2.77 MB
-
 Map-of-human-migrations.png 889 × 635; 388 KB
-
 Map07TN.png 3,507 × 2,480; 1.35 MB
-
 Mapa de las migraciones humanas-gl.svg 1,116 × 818; 3.39 MB
-
 MapE.png 1,000 × 792; 157 KB
-
 MapE1.png 1,273 × 913; 456 KB
-
 MapE2.png 2,000 × 2,000; 694 KB
-
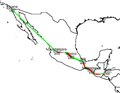
 Mappa migrazione lingue maya.png 627 × 463; 64 KB
-
 Mapz2.png 2,000 × 1,584; 534 KB
-
 Mapz3.png 3,018 × 1,933; 8.68 MB
-
 Mayan Language Migration Map mk.svg 627 × 463; 63 KB
-
 Mayan Language Migration Map PT.png 611 × 447; 68 KB
-
 Mayan Language Migration Map PT.svg 627 × 463; 172 KB
-
 Mayan Language Migration Map.svg 640 × 470; 116 KB
-
 Migracions indoaris.png 882 × 868; 1.56 MB
-
 Migracions vediques.png 566 × 556; 482 KB
-
 Migración Húngara.png 2,263 × 1,364; 5.71 MB
-
 Migrant caravan.pdf 864 × 670; 720 KB
-
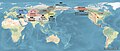
 Migrants in the world 2015-en.svg 1,357 × 670; 2.56 MB
-
 Migration map of Y-DNA haplogroups in East Asia.png 3,640 × 3,072; 892 KB
-
 Migration of Haplogroup NO (Y-DNA).png 1,348 × 996; 244 KB
-
 Migration of the Y chromosome haplogroup C in East Asia.png 1,200 × 1,120; 563 KB
-
 Migration of the Y chromosome haplogroup C, D, N and O in East Asia.jpg 1,200 × 3,093; 517 KB
-
 Migration of the Y chromosome haplogroup D in East Asia.png 1,200 × 947; 514 KB
-
 Migration of the Y chromosome haplogroup N and O in East Asia.png 1,200 × 999; 700 KB
-
 Migration related to haplogroup N & O (Y-DNA) in East Asia.png 1,386 × 1,080; 335 KB
-
 Migration route of Human mtDNA haplogroups.png 1,458 × 794; 273 KB
-

-
 Migration routes of modern humans (2023).png 2,560 × 1,424; 693 KB
-
 Migration routes of subtypes of Helicobacter pylori.png 1,281 × 703; 153 KB
-
 Migration types.svg 675 × 526; 5 KB
-
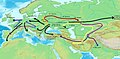
 Migration Yuezhi.jpg 730 × 597; 63 KB
-
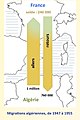 Migrations algériennes, 1947-1955.jpg 524 × 788; 186 KB
-
 Migrations-of-the-human-rac.png 744 × 379; 43 KB
-
 Model for Philippine demographic history.jpg 2,676 × 3,344; 1.46 MB
-
 Movimiento gitano.jpg 647 × 536; 124 KB
-
 Mt-Haplogruppen-Wanderung.png 1,439 × 742; 175 KB
-
 Namigration.png 686 × 717; 219 KB
-
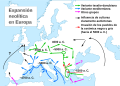 Neolithic expansion-es.svg 680 × 487; 691 KB
-
 Neolithic expansion-pt.svg 680 × 487; 314 KB
-
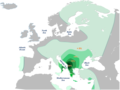
 Neolithic expansion.svg 680 × 487; 608 KB
-
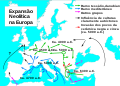
 Neolithic-expansion-rus.png 1,059 × 758; 257 KB
-
 Net migration - Marshall Islands.svg 1,049 × 741; 298 KB
-
 Net migration by Nation.png 1,128 × 799; 337 KB
-
 Net migration rate world.PNG 1,425 × 625; 41 KB
-
 Net migration rate world.png 1,357 × 640; 48 KB
-
 Net Migration Rate, Population Reference Bureau, Current.svg 1,104 × 566; 1.67 MB
-
 Net Migration Rate.svg 1,035 × 531; 1.47 MB
-
 Net migration, 2012-2016 (Our World in Data).svg 850 × 600; 142 KB
-
 Net migration, OWID.svg 850 × 600; 141 KB
-
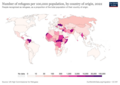 Number-of-refugees-per-100000.png 3,400 × 2,400; 755 KB
-
 Origins 200 AD.png 769 × 665; 297 KB
-

-

-
 Paleolithic population structure of Eurasia.png 834 × 228; 354 KB
-
 Passing of the Great Race - Map 1.jpg 2,472 × 1,619; 3.39 MB
-
 Passing of the Great Race - Map 2.jpg 2,474 × 1,619; 3.46 MB
-
 Passing of the Great Race - Map 3.jpg 2,057 × 1,531; 2.34 MB
-
 Peopling of Eastern Eurasia.png 1,482 × 1,316; 180 KB
-
 Philippine migration patterns.jpg 750 × 879; 116 KB
-
 Phylogenetic structure of Eastern Eurasians日本語.jpg 1,799 × 1,117; 283 KB
-
 Polynesian Migration mk.svg 553 × 553; 603 KB
-
 Polynesian Migration-zh-tw.svg 553 × 553; 517 KB
-
 Polynesian Migration.svg 553 × 553; 664 KB
-

-
 Q1a-F1096 Global Distribution Map.jpg 1,774 × 829; 372 KB
-
 Reurbanisierung.jpg 864 × 864; 70 KB
-
 Reval BV043428469.jpg 4,047 × 3,911; 1.37 MB
-
 Reval BV043428500.jpg 3,757 × 3,930; 1.13 MB
-
 Revised migration routes of modern human 33-19 kya.png 808 × 730; 564 KB
-
 Revised migration routes of modern human.png 1,654 × 1,498; 2.02 MB
-
 Rothert, Bd1Bl03K2 - Fortsetzung der (griechischen) Wanderungen.jpg 2,548 × 1,677; 587 KB
-

-
 Sahul map.jpg 1,606 × 1,543; 150 KB
-
 Schematic depicting major ancestries in Asia日本語.jpg 1,800 × 1,350; 359 KB
-
 Schematic summary of population settlement in Insular Southeast Asia.jpg 2,917 × 555; 403 KB
-
 Schematic summary of population settlement in Insular Southeast Asia日本語.jpg 1,797 × 342; 135 KB
-

-

-
-
 Share of Migrants in the world 2015-en.svg 1,370 × 688; 2.56 MB
-
 Simplified model for demographic history of Europeans during Neolithic.png 1,995 × 1,412; 389 KB
-
 Sino-Tebiten-Austronesian.png 1,000 × 792; 143 KB
-
 Sino-Tebiten-Austronesian1.png 2,000 × 2,000; 640 KB
-
 Solde migratoire - Îles Marshall.svg 1,049 × 741; 298 KB


.jpg)
.jpg)


.png)


.jpg)


.png)


.PNG)

_and_migration_routes.png)


_Apprehensions_of_Unaccompanied_Alien_Children_(UAC),_Fiscal_Years_2009_through_2014_(20180827518).jpg)


.svg)
.svg)


.jpg)


.jpg)


.jpg)


.png)


_in_East_Asia.png)


.png)


.svg)


.jpg)


_Wanderungen.jpg)


.png)
%E6%97%A5%E6%9C%AC%E8%AA%9E.jpg)
.svg)