Category:Inflation graphs of the United States
Jump to navigation
Jump to search
Media in category "Inflation graphs of the United States"
The following 42 files are in this category, out of 42 total.
-
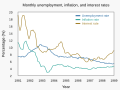 1981–1989 monthly unemployment, inflation, and interest rates.svg 1,000 × 750; 7 KB
-
 2021 Inflation.webp 838 × 839; 58 KB
-
 Consumer Price Index US 1913-2004.png 1,996 × 1,228; 33 KB
-
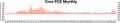 Core PCE Monthly.webp 4,522 × 878; 105 KB
-
 CPI GDP M2 and Velocity.png 850 × 575; 19 KB
-
 CPI vs M2 money supply increases.png 1,168 × 450; 60 KB
-
 Cpi-2010.svg 750 × 500; 15 KB
-
 Dollar value chart.png 453 × 277; 9 KB
-
 FRED graph US CPI for All Urban Consumers 1969–2019.png 1,168 × 470; 37 KB
-
 Fundamentals of Business - Fig. 2.7 - The United States Inflation Rate.jpg 2,086 × 1,670; 149 KB
-
 Infaltion usa.png 1,078 × 716; 50 KB
-
 Inflation and oil price 1969-1989 color corrected.png 1,168 × 620; 33 KB
-
 Inflation and oil.png 5,300 × 2,666; 455 KB
-
 Inflation compared to federal funds rate.jpg 1,444 × 784; 331 KB
-
 Inflation CPI vs. GDP deflator.jpg 960 × 720; 39 KB
-
 Inflation data.webp 3,925 × 1,725; 193 KB
-
 Inflation expectations.webp 1,432 × 496; 33 KB
-
 Inflation federal funds rate.png 5,104 × 2,675; 462 KB
-
 Inflation M2 CPI.webp 1,479 × 592; 53 KB
-
 InflationAndInterestRates.png 2,036 × 686; 61 KB
-
 M2 and Inflation USA.svg 662 × 481; 20 KB
-
 M2, CPI, PCE.webp 3,853 × 1,006; 118 KB
-
 M2andInflation.png 1,103 × 801; 71 KB
-
 Money Supply and Inflation.webp 1,482 × 611; 31 KB
-
 OilVsGasoline1Q22.png 534 × 262; 135 KB
-
 Piped natural gas prices United States.webp 4,502 × 1,153; 119 KB
-
 PPI monthly.webp 4,322 × 954; 73 KB
-
 Producer Price Index data chart.webp 3,726 × 1,172; 96 KB
-
 Producer Price Index Relative Importance.webp 4,968 × 3,888; 841 KB
-
 Producer Price Index.svg 684 × 362; 89 KB
-
 U.S. inflation and compensation measures - v1.png 1,394 × 783; 48 KB
-
 UK and US 1989-present monthly CPI.svg 1,132 × 700; 389 KB
-
 United States GDP Inflation trend.png 979 × 601; 13 KB
-
 US Consumer Price Index Graph.svg 788 × 469; 105 KB
-

-
 US Historical Inflation Ancient.svg 821 × 400; 16 KB
-
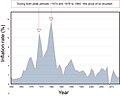
 US Historical Inflation.svg 800 × 400; 36 KB
-
 US inflation rate, expressed as YOY CPI, 1948 thru 2018.png 1,168 × 470; 76 KB
-
 US Inflation rate.png 918 × 452; 18 KB
-
 US Inflation.png 1,200 × 800; 25 KB
-
 US producer price index 2005-2022.webp 1,556 × 398; 10 KB
-
 USACPI1800.svg 750 × 500; 14 KB


