Category:Inflation graphs
Jump to navigation
Jump to search
Subcategories
This category has the following 9 subcategories, out of 9 total.
A
- Inflation graphs of Argentina (11 F)
B
- Inflation graphs of Brazil (15 F)
F
- Inflation graphs of France (7 F)
G
- Inflation graphs of Germany (7 F)
T
- Inflation graphs of Turkey (6 F)
U
V
- Inflation graphs of Venezuela (14 F)
Z
- Inflation graphs of Zimbabwe (7 F)
Media in category "Inflation graphs"
The following 138 files are in this category, out of 138 total.
-
 Actuelew.JPG 645 × 326; 49 KB
-
 Ar-Inflation rate of Japan Economy.png 1,031 × 577; 82 KB
-
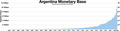 Argentina monetary base.webp 4,283 × 1,101; 63 KB
-
 Argentina Money Supply Increases.webp 4,373 × 1,422; 242 KB
-
 Australia-GDP inflation.png 1,068 × 583; 27 KB
-
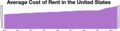
 Average cost of rent in the United States.webp 1,613 × 469; 67 KB
-
 Average cost of rent in the US.webp 1,588 × 407; 18 KB
-
 Bkv inflacio.jpg 1,160 × 696; 63 KB
-
 Canada Inflation.jpg 717 × 429; 51 KB
-
 Ceny ropy naftowej i detaliczne ceny paliw w PLN w latach 2000-2015.jpg 2,383 × 1,431; 483 KB
-
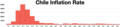 Chile inflation rate.webp 1,534 × 347; 8 KB
-
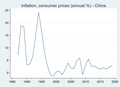 China inflation.png 1,276 × 928; 93 KB
-
 CNX Econ C22 013.jpg 780 × 502; 118 KB
-

-
 Confederate inflation.JPG 478 × 397; 26 KB
-
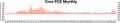 Core PCE Monthly.webp 4,522 × 878; 105 KB
-
 CPI 1914-2022.webp 3,962 × 1,902; 221 KB
-
 CPI and annual inflation for Austria 1800–2018.jpg 1,229 × 794; 222 KB
-
 CPI of Jajangmyeon from 1975 to 2013 at Korea.png 1,223 × 793; 59 KB
-
 Cpi-categories.jpg 1,260 × 800; 252 KB
-
 Cpis.PNG 1,269 × 764; 52 KB
-
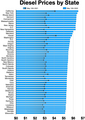 Diesel Prices by State.webp 631 × 888; 141 KB
-
 Dollar Crash 2022.jpg 480 × 288; 23 KB
-
 Développement de la masse monétaire et de l'inflation en Russie.svg 490 × 270; 16 KB
-
 Euro inflation.webp 8,009 × 2,058; 125 KB
-
 Evolution of the MRO rate and the HICP for the EU.png 1,426 × 854; 94 KB
-
 Food Price Index.webp 1,550 × 452; 76 KB
-
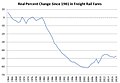 Freight rail fares.jpg 766 × 533; 60 KB
-
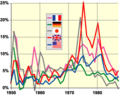 G-5 inflation 50-94 chart.png 340 × 272; 18 KB
-
 Garrett Relation.tif 1,038 × 826; 2.45 MB
-
 Gdp inflation activepopulation hungary.png 603 × 353; 40 KB
-
 Gefühlte Inflation.svg 638 × 412; 96 KB
-
 Geldmenge und Inflation im Zarenreich.svg 490 × 270; 16 KB
-
 Inflation 2000 bis 2008.svg 237 × 202; 31 KB
-
 Gold Inflation Adjusted.png 1,179 × 772; 62 KB
-
 Graf jednotlivých měřítek inflace.gif 362 × 243; 11 KB
-
 Graphique point d'indice et inflation.jpg 1,729 × 1,199; 541 KB
-
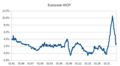 HICP Eurozone.png 612 × 338; 10 KB
-
 HKD vs USD over the year.svg 563 × 348; 81 KB
-
 Index inflationis Rei publicae Dominicianae.jpg 645 × 600; 73 KB
-
 Index spotřebitelských cen, meziroční změna v %.jpg 613 × 574; 150 KB
-
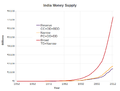 India Money Supply Components--Larger Label Fonts.png 939 × 711; 65 KB
-
 Indice-inflacion.jpeg 645 × 600; 95 KB
-
 Indonesia money supply increases and inflation.webp 1,526 × 389; 34 KB
-
 INFALTION the method of measuring inflation rates.jpg 375 × 299; 21 KB
-
 Infaltion usa keyniasin diagram.png 738 × 553; 25 KB
-
 Inflacja2010.JPG 648 × 341; 27 KB
-
 Infladexchil.gif 985 × 510; 43 KB
-
 INFLATION BRENT USD.jpg 1,320 × 532; 100 KB
-
 Inflation compounded over 40 years.webp 1,452 × 597; 52 KB
-
 Inflation Diagram(1).png 292 × 246; 4 KB
-
 Inflation Diagram.png 292 × 246; 4 KB
-
 Inflation Growth.JPG 689 × 507; 64 KB
-
 Inflation in interwar Poland.png 602 × 378; 165 KB
-
 Inflation in Latin America, logarithmic scale.svg 822 × 446; 29 KB
-
 Inflation Iran CPI.jpg 1,500 × 1,125; 234 KB
-
 Inflation Rate 1999-2018.png 641 × 330; 19 KB
-
 Inflation rate in Iran (1315-1392).svg 720 × 540; 61 KB
-
 Inflation rate in Iran (1325-1396).svg 576 × 432; 50 KB
-
 Inflation rate of Japan Economy editted.png 1,031 × 577; 106 KB
-

-
 Inflation Russia 2008-2017.png 1,200 × 900; 11 KB
-
 Inflation Since January 2021.webp 3,884 × 1,930; 183 KB
-
 Inflation usa.png 595 × 291; 18 KB
-
 Inflation value of dollar.webp 5,110 × 3,890; 432 KB
-
 Inflation Vietnam 1976-1986 (Retail price).png 425 × 331; 3 KB
-
 Inflation Yen USD 1971-2009 de.svg 1,010 × 421; 71 KB
-
 Inflation, YtoY, Belarus 1992-2022.png 1,293 × 831; 44 KB
-
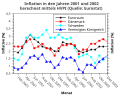 Inflation-2001-2002-euroraum-DEN-SWE-GBR.svg 487 × 394; 69 KB
-
 Inflation-and-gdp-nigeria.jpg 1,101 × 713; 75 KB
-
 Inflation-colombia-1992-2012.gif 970 × 604; 11 KB
-
 Inflation-Colombia.1992-2007.svg 315 × 249; 818 KB
-
 Inflation-Iran.png 740 × 350; 15 KB
-
 Inflationsrate in Sri Lanka 2020-23.svg 512 × 243; 36 KB
-
 Inflationsraten Nicht-Eurozone.png 282 × 341; 9 KB
-
 Inflazione italiana.jpg 872 × 495; 96 KB
-
 Inflgeld1417.gif 456 × 306; 5 KB
-
 Insee-timbre.png 1,031 × 641; 28 KB
-
 Iran-inflation-vs-min-wage-1386-1394.svg 864 × 490; 144 KB
-
 Jadrova inflacia.jpg 650 × 426; 236 KB
-
 Japan Inflation Rate, Source Trading Economics.jpg 1,436 × 662; 60 KB
-
 Japan money supply and inflation.webp 1,545 × 394; 48 KB
-
 Konsumentenpreisindex für die Schweiz und die USA.png 6,801 × 6,803; 1.23 MB
-
 KPI Norge prosent.jpg 962 × 393; 159 KB
-
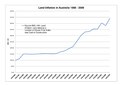 Land Inflation in Australia 1986 - 2009.pdf 1,752 × 1,239; 214 KB
-
 M2.vs.CPI.png 638 × 465; 15 KB
-
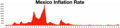 Mexico inflation rate.webp 1,709 × 404; 9 KB
-
 Misery Index 2021.png 1,007 × 742; 82 KB
-
 Misery index Greece.png 970 × 604; 23 KB
-
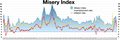 Misery Index.webp 3,769 × 1,257; 446 KB
-
 Monthly investments in the SP500 using DCA and VA.png 1,224 × 1,056; 131 KB
-
 New Zealand money supply and inflation.webp 1,571 × 437; 65 KB
-
 Nicaragua inflation rate 1980-1993.webp 1,505 × 417; 9 KB
-
 Norwegen Inflation 1813.JPG 987 × 529; 73 KB
-
 Nutzeninflation.jpg 353 × 300; 15 KB
-

-
 Philips and Macro.png 1,058 × 418; 75 KB
-
 Philips Curve.jpg 960 × 720; 23 KB
-
 Philips curve.png 683 × 474; 46 KB
-
 Piped natural gas prices United States.webp 4,502 × 1,153; 119 KB
-
 PL inflacja wykres.svg 512 × 267; 20 KB
-
 Plithorismos.svg 1,864 × 670; 22 KB
-
 Polish inflation.PNG 332 × 214; 4 KB
-
 PPI monthly.webp 4,322 × 954; 73 KB
-
 PreisindizesEngl.png 968 × 614; 35 KB
-
 PreisindizesKonsum.png 968 × 614; 34 KB
-
 Producer Price Index data chart.webp 3,726 × 1,172; 96 KB
-
 Producer Price Index Relative Importance.webp 4,968 × 3,888; 841 KB
-
 Residential natural gas prices.webp 4,332 × 1,633; 136 KB
-
 Russian inflation rate 1993-2022.webp 1,538 × 479; 7 KB
-
 S&P 500 Chart 2023.svg 990 × 765; 1.72 MB
-
 Screen shot proj fig.jpg 868 × 433; 79 KB
-
 South Korean inflation.webp 1,619 × 402; 39 KB
-
 Span prices.JPG 413 × 292; 20 KB
-
 Spirale déflationniste schéma.svg 2,287 × 1,281; 20 KB
-
 Tasa-inflacion.jpeg 645 × 600; 112 KB
-
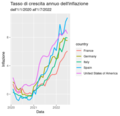 Tasso di crescita annuo dell'inflazione.png 457 × 441; 57 KB
-
 Tatsächliche BIP-Schrumpfung 2019.jpg 1,219 × 540; 85 KB
-
 Texas electricity rates.jpg 855 × 527; 79 KB
-
 Time Series Representation of Social Security Expenditure .jpg 435 × 310; 28 KB
-

-
 Uk Inflation data.webp 3,101 × 847; 59 KB
-
 Uk inflation history.webp 3,394 × 1,169; 65 KB
-
 Uk m4 and inflation.webp 1,431 × 492; 32 KB
-
 UKCPIApril2012ToApril2022.png 1,555 × 951; 65 KB
-
 Unemployment Graph final.png 831 × 517; 35 KB
-
 Unemployment Graph mine.png 830 × 521; 36 KB
-
 Unemployment vs Inflation vs Inverted yield curve.webp 1,417 × 445; 45 KB
-
 US inflation rates.jpg 1,421 × 652; 65 KB
-
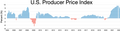 US producer price index 2005-2022.webp 1,556 × 398; 10 KB
-
 US-Inflation-by-year.png 738 × 362; 7 KB
-
 USprofitsVsCPIchange.png 968 × 450; 57 KB
-
 Venezuela hyperinflation.webp 1,543 × 510; 14 KB
-
 VPI-IWI-EUCSBS.png 1,516 × 926; 183 KB
-
 Wage productivity.jpg 973 × 557; 95 KB
-
 Wage Spiral.png 960 × 720; 30 KB
-
 Wages in the United States.webp 1,609 × 829; 39 KB
-
 Zimbabwe inflation.webp 917 × 416; 6 KB


.png)


.svg)
.svg)


.png)


