Category:Global warming maps
Jump to navigation
Jump to search
Subcategories
This category has the following 7 subcategories, out of 7 total.
G
I
M
Media in category "Global warming maps"
The following 75 files are in this category, out of 75 total.
-
 95307main fig4m.jpg 800 × 517; 135 KB
-

-

-
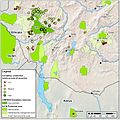
 Amazon map of forest loss, fires, agricultural and cattle areas, etc.jpg 510 × 627; 491 KB
-
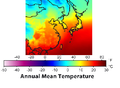 Annual Average Temperature Map East Asia.png 324 × 238; 44 KB
-
 Antarctic temps.AVH1982-2004.jpg 540 × 450; 51 KB
-
 Antarctica temps2 1957-2006.jpg 3,200 × 2,917; 749 KB
-
 AntarcticaTemps 1957-2006.jpg 720 × 480; 267 KB
-
 AntarcticaTemps3 1957-2006.png 863 × 656; 821 KB
-
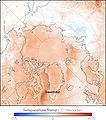 Arctic Temperature Trend 1987-2007.jpg 350 × 396; 53 KB
-
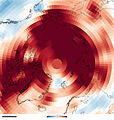 ArcticYearlongTempAnom HR.jpg 1,439 × 1,512; 1.1 MB
-
 Average Temperature Increase in Indonesia 1981-2018.jpg 1,280 × 768; 194 KB
-
 Carbon Sources and Sinks.svg 960 × 696; 6 KB
-

-
 Climate Change Indicators - Changes in Total Snowfall (9493129893).png 670 × 677; 119 KB
-

-
 CO2-Fußabdruck von Flaschenwasser.jpg 1,240 × 722; 205 KB
-
 Deluge-NASA.png 400 × 420; 46 KB
-

-
-

-
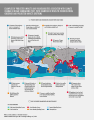
 Extreme weather events 2014-2015.png 1,428 × 929; 1.14 MB
-
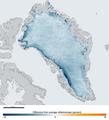 Greenland Albedo Change.png 1,438 × 1,584; 1.49 MB
-
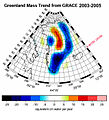 Greenland Ice Mass Trend.jpg 1,268 × 1,392; 613 KB
-
 Ice Map NASA March 9 2008.jpg 2,479 × 3,508; 1 MB
-
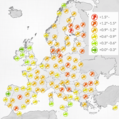 Increase of average yearly temperature in Europe (1900-2017).png 1,200 × 1,205; 355 KB
-
-
-

-

-

-

-

-

-

-
 NASA- First Map Of Thawed Areas Under Greenland Ice Sheet (28129608823).jpg 985 × 1,781; 217 KB
-
 Newyork heat island.jpg 540 × 1,084; 149 KB
-
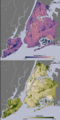 Newyork heat island.PNG 376 × 755; 464 KB
-

-

-

-

-
-
-
-
-
-
-
-
-
-
-
 Ocean heat anomaly map 2020.jpg 1,400 × 1,200; 465 KB
-
 PalmerLand Wilkinsiceshelf retreat19472009.jpg 1,904 × 1,571; 927 KB
-
 Peatland loss chart.JPG 300 × 196; 25 KB
-
 Polar Bear Habitat.png 981 × 879; 605 KB
-

-
 Puncak Jaya glaciers 1850-2003 evolution map-fr.gif 511 × 590; 2.45 MB
-
 Asian Super Grid.jpg 600 × 610; 94 KB
-
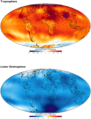 RSS troposphere stratosphere trend.png 1,821 × 2,386; 1.57 MB
-
 Sealevel SE US 1m.gif 550 × 389; 117 KB
-
 Sgubin2017 spg amoc collapse.jpg 788 × 1,273; 270 KB
-
 Temperature anomalies 2010-06.svg 2,048 × 1,536; 601 KB
-

-
-

-
-
 Trend June max temp 1950 2009.png 740 × 449; 56 KB
-
 Trend June TX.png 740 × 449; 58 KB
-
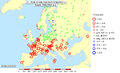
 Tropical Storm Map fr.png 920 × 632; 108 KB
-
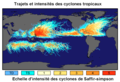
 Tropical storms on Earth.png 800 × 550; 351 KB
-
 Uars ozone waves.jpg 540 × 382; 157 KB
-
 US-climate-alliance.svg 928 × 588; 44 KB
-
 VerneGlobal global connectivity.gif 330 × 511; 19 KB
-
 WAISDivideReg.jpeg 793 × 554; 283 KB

.png)


.gif)
.png)
.png)


.png)
.jpg)

.jpg)


.png)
.png)
.png)
.png)


-Predicting-Future-Trends-pone.0047981.g001.jpg)
-Predicting-Future-Trends-pone.0047981.g002.jpg)
-Predicting-Future-Trends-pone.0047981.g005.jpg)
-Predicting-Future-Trends-pone.0047981.g007.jpg)


