Category:Genetic studies on Spanish
Jump to navigation
Jump to search
English: Genetic studies on Spaniards, people of Spain, a country on the Iberian Peninsula, Southern Europe.
Español: Estudios genéticos en español.
Subcategories
This category has the following 4 subcategories, out of 4 total.
Media in category "Genetic studies on Spanish"
The following 38 files are in this category, out of 38 total.
-
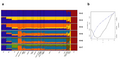 ADMIXTURE analysis of Iberian populations.png 3,000 × 1,475; 1.48 MB
-
 ADMIXTURE results of Arabian and other populations.png 2,050 × 1,073; 342 KB
-
 Ancestral components of the Balto-Slavic gene pool.PNG 2,247 × 1,461; 833 KB
-
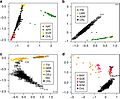
 Characterising genetic contributions to Iberia.png 2,065 × 1,702; 938 KB
-
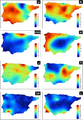
 Effective Migration Maps estimated for the Iberian dataset.png 1,899 × 672; 312 KB
-
 Estimates of shared ancestry between Spanish individuals.png 1,999 × 2,443; 3.04 MB
-
 European Ancestry Specific PCA of South American populations.PNG 2,182 × 796; 373 KB
-
 European population substructure.png 1,792 × 1,280; 981 KB
-
 F2 variant sharing across 1000 Genomes individuals.png 1,163 × 1,120; 1.21 MB
-
 Figure 2a (Cropped) PCA of Europeans.jpg 337 × 356; 19 KB
-

-
 Genetic PCA of European countries 2022.jpg 4,189 × 3,184; 4.15 MB
-
 Gentic Map of Europe.png 781 × 544; 181 KB
-
 Geographic maps of the mtDNA haplogroup frequencies in Iberian Peninsula.PNG 3,107 × 4,500; 4.82 MB
-
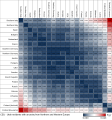 Heat map of pair-wise Fst between European populations.svg 985 × 1,051; 601 KB
-
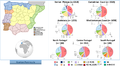
 Locations of donor groups and ancestry profiles of Iberian clusters.png 1,984 × 1,178; 349 KB
-
 MtDNA haplogroup frequencies by (politically-defined) Spanish Autonomous Regions.png 6,667 × 4,159; 3.07 MB
-
 MtDNA haplogroup frequencies in the main Iberian regions.PNG 4,000 × 2,204; 2.39 MB
-
 MtDNA haplogroup profiles registered in some populations of the Iberian Peninsula.jpg 1,200 × 1,043; 155 KB
-

-
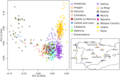 PCA analysis of 17 Iberian populations.png 1,600 × 1,032; 504 KB
-
 PCA analysis of several European populations.jpg 685 × 712; 62 KB
-
 PCA of 2305 Estonian samples.webp 1,804 × 735; 112 KB
-
 PCA of Italians and European and Mediterranean populations.png 2,008 × 3,937; 1.09 MB
-
 PCA of the Belgians within European populations.png 1,349 × 961; 131 KB
-
 PCA plot of European individuals.png 853 × 595; 63 KB
-
 PCA results of Arabian and other populations.png 1,352 × 1,223; 329 KB
-
 Phylogeny and geographical distribution of European MSY lineages.jpg 946 × 451; 86 KB
-
 Plos.Balkans.2-ar.png 4,000 × 1,568; 855 KB
-
 Plos.Balkans.2.png 4,033 × 1,581; 415 KB
-

-
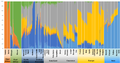
 Spanish individuals grouped into clusters using genetic data only.png 1,924 × 2,548; 1.47 MB
-
 Spatial ancestry analysis of Chilean and others.jpg 946 × 778; 102 KB
-
 Sub-continental origin of European haplotypes derived from admixed genomes.png 4,086 × 3,001; 2.54 MB
-
 Ultra-fine-scale genetic structure within Spain.png 2,004 × 1,513; 2.83 MB
-
 Variation and timing of Basque-like genetic contributions in Iberia.png 2,000 × 1,137; 98 KB
-

-
 YDNAR1b-SRY2627.jpg 699 × 600; 67 KB


_PCA_of_Europeans.jpg)


_Spanish_Autonomous_Regions.png)


.png)


