Category:Genetic studies on Basques
Jump to navigation
Jump to search
Media in category "Genetic studies on Basques"
The following 45 files are in this category, out of 45 total.
-
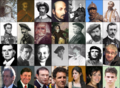
 24 Basque people.jpg 666 × 420; 303 KB
-
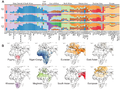 ADMIXTURE analysis of Horn of Africa populations in a broad context.png 4,041 × 3,002; 3.71 MB
-
 ADMIXTURE analysis of Iberian populations.png 3,000 × 1,475; 1.48 MB
-
 ADMIXTURE analysis of Italians.png 2,522 × 609; 185 KB
-
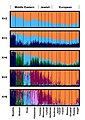
 ADMIXTURE results of North African and other populations.png 1,708 × 329; 291 KB
-
 Basque Country Location and Provinces in Europe Map.svg 562 × 481; 1.3 MB
-
 Basque Country location map.png 250 × 115; 4 KB
-
 Basque people.png 1,057 × 776; 1.38 MB
-
 Characterising genetic contributions to Iberia.png 2,065 × 1,702; 938 KB
-
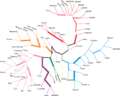 Consensus Neighbor-Joining Tree of Populations.png 4,180 × 3,350; 85 KB
-
 Effective Migration Maps estimated for the Iberian dataset.png 1,899 × 672; 312 KB
-
 Estimates of shared ancestry between Spanish individuals.png 1,999 × 2,443; 3.04 MB
-

-

-

-
 Genome admixture deconvolution karyogram of an Egyptian.png 1,180 × 976; 333 KB
-
 Locations of donor groups and ancestry profiles of Iberian clusters.png 1,984 × 1,178; 349 KB
-
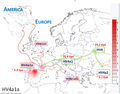 Map of Europe showing the frequency distribution of mtDNA haplogroup HV4a1a.png 2,595 × 2,030; 940 KB
-

-
-
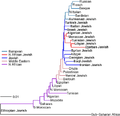
 Maximum parsimony tree of entire mtDNA genomes belonging to haplogroup HV4.png 2,927 × 2,116; 544 KB
-
 MDS analysis of European, Jewish, and Middle Eastern populations.png 1,357 × 786; 315 KB
-
 MtDNA haplogroup frequencies by (politically-defined) Spanish Autonomous Regions.png 6,667 × 4,159; 3.07 MB
-
 MtDNA haplogroup profiles registered in some populations of the Iberian Peninsula.jpg 1,200 × 1,043; 155 KB
-

-

-
 Neighbor-joining tree of Jewish people and others.png 520 × 504; 64 KB
-
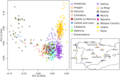 PCA analysis of 17 Iberian populations.png 1,600 × 1,032; 504 KB
-
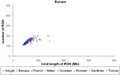
 PCA analysis of several European populations.jpg 685 × 712; 62 KB
-
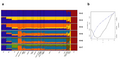
 PCA and ADMIXTURE plot of Algerian.png 1,051 × 949; 388 KB
-

-

-
 Phylogeny and geographical distribution of European MSY lineages.jpg 946 × 451; 86 KB
-
 Plos.Balkans.2-ar.png 4,000 × 1,568; 855 KB
-
 Plos.Balkans.2.png 4,033 × 1,581; 415 KB
-
 Population relationships from genome-wide haplotypes.png 4,760 × 2,608; 1.22 MB
-
 Population structure for European, Jewish, and Middle Eastern populations.jpg 1,200 × 1,697; 499 KB
-
 ROH of European populations.png 973 × 611; 107 KB
-

-
 Spanish individuals grouped into clusters using genetic data only.png 1,924 × 2,548; 1.47 MB
-

-
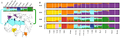
 Sub-continental origin of European haplotypes derived from admixed genomes.png 4,086 × 3,001; 2.54 MB
-
 Ultra-fine-scale genetic structure within Spain.png 2,004 × 1,513; 2.83 MB
-
 Variation and timing of Basque-like genetic contributions in Iberia.png 2,000 × 1,137; 98 KB
-


_Spanish_Autonomous_Regions.png)


.png)


