Category:Economic statistics for the Netherlands
Jump to navigation
Jump to search
Subcategories
This category has the following 3 subcategories, out of 3 total.
W
Media in category "Economic statistics for the Netherlands"
The following 31 files are in this category, out of 31 total.
-
 2006Dutch exports.PNG 1,425 × 625; 59 KB
-
 2012 Netherlands Products Export Treemap.png 752 × 583; 83 KB
-
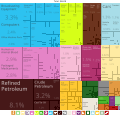
 2014 Netherlands Products Export Treemap.png 750 × 520; 149 KB
-
 Aardolieproduktie nederland.png 983 × 523; 56 KB
-
 Aardolieproduktie nederland.svg 654 × 348; 86 KB
-
 Aardoliewinningimport nederland.svg 379 × 198; 57 KB
-

-
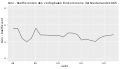
 Anteil Top Dezil NL EU-SILC.svg 512 × 284; 21 KB
-
 BBP 2002 0 40000.PNG 968 × 602; 26 KB
-
 BBP 2002 20000 40000.PNG 968 × 602; 24 KB
-
 Dienstboden.jpg 960 × 720; 43 KB
-
 Diffdiesbenz.jpg 720 × 504; 100 KB
-
 Distribution of Wealth in the Netherlands.svg 800 × 600; 24 KB
-
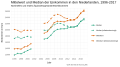 Durchschnittliches und Median Einkommen NE 1996-2017 EU-SILC.svg 512 × 284; 30 KB
-
 Dutch current account.jpg 784 × 502; 43 KB
-
 Dutch house prices CBS LibreOffice.png 714 × 452; 330 KB
-
 Dutch house prices CBS.png 970 × 604; 17 KB
-
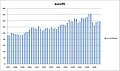 Euro95-2009-cbs.jpg 812 × 478; 145 KB
-
 Netherlands Exports Treemap 2017.svg 900 × 900; 551 KB
-
 Gini disposable income plot netherlands 1995 2017.svg 512 × 293; 8 KB
-
 Handelsrelatie Nederland - China (10854474216).jpg 2,450 × 3,169; 1.98 MB
-
 Handelsrelatie Nederland - Indonesië (10958882393).jpg 2,450 × 3,034; 1.95 MB
-
 House prices in the Netherlands.png 970 × 604; 17 KB
-
 Inflatie Nederland.png 700 × 350; 11 KB
-
 Ledentallen NVV.png 640 × 480; 4 KB
-
 Netherlands treemap.png 1,107 × 864; 169 KB
-
 NoodwetDrees.jpg 960 × 720; 70 KB
-
 Staatsschuld pct bbp.PNG 977 × 638; 30 KB
-
 Typen pensioenovereenkomsten in Nederland.png 970 × 604; 31 KB
-
 Uitkeringen per 1000 huishoudens.png 483 × 307; 8 KB
-
 Uitkeringen per 1000.png 529 × 413; 13 KB


.jpg)
.jpg)


