Category:Income distribution maps of the Netherlands
Jump to navigation
Jump to search
Media in category "Income distribution maps of the Netherlands"
The following 13 files are in this category, out of 13 total.
-
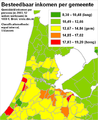 Besteedbaar inkomen equal interval map.png 720 × 878; 61 KB
-
 Besteedbaar inkomen handmatig 100 pct map.png 720 × 878; 65 KB
-
 Besteedbaar inkomen handmatig 100 pct met extra labels map.png 720 × 878; 69 KB
-
 Besteedbaar inkomen handmatig extremen map.png 720 × 878; 61 KB
-
 Besteedbaar inkomen nat breaks map.png 720 × 877; 61 KB
-
 Besteedbaar inkomen quantile 18 klassen map.png 720 × 878; 64 KB
-
 Besteedbaar inkomen quantile 3 klassen map.png 720 × 878; 58 KB
-
 Besteedbaar inkomen quantile 5 klassen andere kleuren.png 720 × 877; 60 KB
-
 Besteedbaar inkomen quantile 7 klassen map.png 720 × 878; 62 KB
-
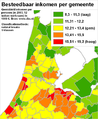
 Besteedbaar inkomen quantile map.png 720 × 878; 61 KB
-
 Besteedbaar inkomen standaard deviatie map.png 720 × 878; 66 KB
-
 Dutch provinces by nominal GRP in 2016.png 4,290 × 4,700; 1.12 MB
-
 Dutch provinces by nominal GRP per capita in 2016.png 4,290 × 4,700; 1.11 MB


