Category:Economic charts of India
Jump to navigation
Jump to search
Media in category "Economic charts of India"
The following 50 files are in this category, out of 50 total.
-

-
 1 AD to 2003 AD percent GDP contribution of India to world GDP with history.png 10,619 × 6,287; 1.02 MB
-
 1 AD to 2008 AD trends in % GDP contribution by major economies of the world.png 9,606 × 6,562; 1,009 KB
-

-

-
 1951 to 2013 Trend Chart of Sector Share of Total GDP for each year, India.png 9,600 × 5,650; 556 KB
-
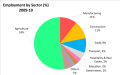 2010 Percent labor employment in India by its economic sectors.png 10,071 × 6,281; 742 KB
-
 2012 India Products Export Treemap.png 753 × 581; 81 KB
-
 April 2013 to March 2014 Export commodities from India, by percent value in US$.png 11,913 × 8,175; 2.25 MB
-
 April 2013 to March 2014 Import commodities from India, by percent value in US$.png 11,962 × 8,113; 1.09 MB
-
 BPL Data GOI.png 1,058 × 789; 140 KB
-
 BusinessOfTop10BollywoodMovies.JPG 970 × 454; 42 KB
-
 CCI 2009 jp.JPG 647 × 318; 31 KB
-
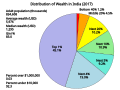 Distribution of Wealth in India.svg 800 × 600; 24 KB
-
 GDP growth India 2013–2018 quarterly.svg 704 × 316; 13 KB
-
 GDP per capita of China and India.svg 750 × 560; 11 KB
-
 GDP per capita of India (1820 to present).png 728 × 402; 1.12 MB
-
 GDP rate of India, 1901-2021 (hy).png 998 × 426; 66 KB
-
 Grafico2-BRICs.png 606 × 538; 34 KB
-
 Grafico3-BRICs.png 609 × 472; 50 KB
-
 Housing Characteristics on Reservations.png 497 × 311; 24 KB
-
 Housing Charactersitics.jpg 497 × 311; 32 KB
-
 IEP Analysis Mean article count per student, by course.png 627 × 502; 11 KB
-
 IEP Analysis Percentage of content survival, by course.png 627 × 502; 11 KB
-
 India GDP without labels.PNG 1,396 × 890; 44 KB
-
 Indian States Growth Comparison.JPG 507 × 337; 34 KB
-
 Indianfilms bylanguage.PNG 771 × 526; 31 KB
-
 Indias growth rate of real GDP per capita(1950-2004).png 503 × 475; 37 KB
-
 Indias growth rate of real GDP per capita(1950-2006).png 567 × 469; 6 KB
-
 INR-USD v2.svg 700 × 400; 207 KB
-
 JPY-INR v2.svg 700 × 400; 251 KB
-
 Net Interest Income of New Private Sector Banks in India.png 1,102 × 664; 23 KB
-
 Net NPA Ratio of New Private Sector Banks in India.png 1,350 × 709; 30 KB
-
 Odisha Budget Expenditure 2014 15.png 721 × 483; 44 KB
-
 Pds diagram 1.png 819 × 460; 17 KB
-
 Pds diagram 2.png 819 × 460; 17 KB
-
 Per capita GDP of South Asian economies & SKorea (1950-1995).png 769 × 464; 38 KB
-
 Per capita GDP of South Asian economies & SKorea (1950-1995).svg 1,278 × 631; 143 KB
-
 Per capita GDP of South Asian economies.png 1,782 × 1,070; 393 KB
-
 Poverty india.png 628 × 466; 142 KB
-
 Precolonial national income of India(1857-1900).png 1,010 × 501; 34 KB
-
 Private and public industry employment in India(2003).png 664 × 389; 25 KB
-
 Scheduled banking structure in India.png 476 × 635; 57 KB
-
 SMGULP-collection-flowchart.png 887 × 519; 14 KB
-
 Stat1.jpg 496 × 278; 24 KB
-
 Summers 08.JPG 603 × 435; 29 KB
-
 US, China and India projected GDP growth 2009-2050 Pwc.png 1,700 × 970; 41 KB
-
 Value of Indian rupee as per dollar & pound (1980-2005).png 596 × 410; 26 KB
-
 Wired-wireless.jpg 362 × 218; 19 KB
-
 Wirtschaftswachstum Indiens.svg 1,356 × 390; 380 KB


.png)
.png)


.png)
.png)


.png)
.svg)


.png)
.png)


.png)
