Category:Economic charts of China
Jump to navigation
Jump to search
Subcategories
This category has the following 2 subcategories, out of 2 total.
T
- Treemaps on exports of China (15 F)
- Treemaps on Import of China (2 F)
Media in category "Economic charts of China"
The following 64 files are in this category, out of 64 total.
-

-
 1 AD to 2003 AD percent GDP contribution of China to world GDP with history.png 10,619 × 6,350; 1.07 MB
-
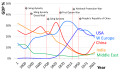
 1 AD to 2008 AD trends in % GDP contribution by major economies of the world.png 9,606 × 6,562; 1,009 KB
-

-
 China 1978-2010.jpg 960 × 720; 72 KB
-
 China tax 2011.png 704 × 357; 14 KB
-
 Distribution of Wealth in China.svg 800 × 600; 24 KB
-
 Export Russia-China 2013.jpg 237 × 450; 24 KB
-
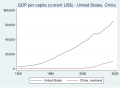 GDP per capita - United States, China.svg 495 × 360; 6 KB
-
 JZEG003.png 720 × 432; 17 KB
-

-
 People's Republic of China 1990-2018.jpg 1,248 × 619; 62 KB
-
 Structure of Russian exports to China.jpg 1,000 × 662; 151 KB
-
 中俄PPP3.png 1,309 × 809; 74 KB
-
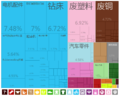
 中国出口到乌兹别克斯坦的产品 (1995 - 2012).png 907 × 654; 102 KB
-
 中国出口到乌干达的产品 (1995 - 2012).PNG 1,053 × 771; 114 KB
-
 中国出口到坦桑尼亚的产品 (2012).png 1,009 × 806; 118 KB
-
 中国出口到塞内加尔.PNG 1,405 × 559; 188 KB
-
 中国出口到布基纳法索 (1995 - 2012).PNG 1,068 × 777; 140 KB
-
 中国出口到布隆迪的产品 (2012).png 1,003 × 805; 117 KB
-
 中国出口到拉脱维亚的产品 (1995 - 2012).png 1,058 × 762; 137 KB
-
 中国出口到玻利维亚的产品 (2012).png 911 × 732; 105 KB
-
 中国出口到瓦努阿图的产品 (1995 - 2012).png 759 × 548; 76 KB
-
 中国出口到肯尼亚的产品 (1995).png 1,005 × 805; 117 KB
-
 中国出口到苏里南的产品 (1995 - 2012).png 1,061 × 763; 122 KB
-
 中國大陸與土庫曼斯坦的貿易 - hans.PNG 1,004 × 593; 17 KB
-
 中國大陸與土庫曼斯坦的貿易 - hant.PNG 1,003 × 594; 17 KB
-
 乌兹别克斯坦出口到中国的产品 (1995 - 2012).png 910 × 654; 75 KB
-
 乌干达出口到中国的产品 (1995 - 2012).PNG 1,061 × 761; 141 KB
-
 产品中国出口到吉布提 (1995 - 2012).PNG 904 × 645; 91 KB
-
 产品中国出口到喀麦隆 (2012).PNG 909 × 731; 105 KB
-
 产品中国出口到基里巴斯 (1995 - 2012).PNG 994 × 714; 146 KB
-
 产品中国出口到塞拉利昂 (2012).PNG 912 × 730; 70 KB
-
 产品中国出口到塞舌尔 (1995 - 2012).PNG 910 × 653; 104 KB
-
 产品中国出口到挪威 (1995 - 2012).PNG 907 × 649; 96 KB
-
 产品中国出口到摩尔多瓦 (1995 - 2012).PNG 910 × 652; 92 KB
-
 产品中国出口到摩洛哥 (2012).PNG 1,004 × 804; 115 KB
-
 产品中国出口到斯洛文尼亚 (2012).PNG 916 × 733; 99 KB
-
 产品中国出口到格林纳达 (2012).PNG 913 × 733; 94 KB
-
 产品中国出口到津巴布韦 (2012).PNG 1,002 × 803; 111 KB
-
 产品中国出口到突尼斯 (2012).PNG 910 × 730; 101 KB
-
 产品吉布提出口到中国 (1995 - 2012).PNG 907 × 655; 82 KB
-
 产品喀麦隆出口到中国 (2012).PNG 908 × 730; 49 KB
-
 产品坦桑尼亚出口到中国 (2012).PNG 1,004 × 808; 89 KB
-
 产品基里巴斯出口到中国 (1995 - 2012).PNG 997 × 712; 68 KB
-
 产品塞拉利昂出口到中国 (2012).PNG 905 × 729; 29 KB
-
 产品塞舌尔出口到中国 (1995 - 2012).PNG 909 × 652; 58 KB
-
 产品布隆迪出口到中国 (2012).PNG 1,005 × 805; 34 KB
-
 产品摩尔多瓦出口到中国 (1995 - 2012).PNG 907 × 665; 94 KB
-
 产品摩洛哥出口到中国 (2012).PNG 1,005 × 804; 89 KB
-
 产品斯洛文尼亚出口到中国 (2012).PNG 916 × 733; 96 KB
-
 产品格林纳达出口到中国 (2012).PNG 909 × 731; 29 KB
-
 产品津巴布韦出口到中国 (2012).PNG 1,004 × 807; 67 KB
-
 产品玻利维亚出口到中国 (2012).PNG 916 × 732; 35 KB
-
 产品突尼斯出口到中国 (2012).PNG 911 × 731; 97 KB
-
 产品肯尼亚出口到中国 (1995).PNG 1,003 × 804; 80 KB
-
 塞内加尔出口到中国.PNG 1,407 × 553; 114 KB
-
 布基纳法索出口到中国 (1995 - 2012).PNG 1,061 × 764; 88 KB
-
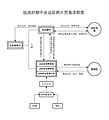 抗战时期中共边区鸦片贸易流程图.jpg 798 × 878; 64 KB
-
 拉脱维亚出口到中国的产品 (1995 - 2012).png 1,061 × 779; 135 KB
-
 新加坡出口到香港的产品 (2012).svg 600 × 507; 534 KB
-
 瓦努阿图出口到中国的产品 (1995 - 2012).png 758 × 543; 74 KB
-
 苏里南出口到中国的产品 (1995 - 2012).png 1,061 × 762; 101 KB
-
 香港出口到新加坡的产品 (2012).svg 600 × 507; 480 KB


.png)
.PNG)
.png)
.PNG)
.png)
.png)
.png)
.png)
.png)
.png)


.png)
.PNG)
.PNG)
.PNG)
.PNG)
.PNG)
.PNG)
.PNG)
.PNG)
.PNG)
.PNG)
.PNG)
.PNG)
.PNG)
.PNG)
.PNG)
.PNG)
.PNG)
.PNG)
.PNG)
.PNG)
.PNG)
.PNG)
.PNG)
.PNG)
.PNG)
.PNG)
.PNG)
.PNG)
.PNG)

.png)
.svg)
.png)
.png)
.svg)