Category:Demographic maps of Belarus
Jump to navigation
Jump to search
Subcategories
This category has the following 5 subcategories, out of 5 total.
Media in category "Demographic maps of Belarus"
The following 54 files are in this category, out of 54 total.
-
 Average life expectancy at birth in Belarus (2018, be).png 2,000 × 1,785; 391 KB
-
 Average life expectancy at birth in Belarus (2018, en).png 2,000 × 1,785; 393 KB
-
 Average life expectancy at birth in Belarus (2018, ru).png 2,000 × 1,785; 392 KB
-
 Belarus Cities' Population Dynamics.PNG 1,550 × 1,212; 147 KB
-
 Belarus Over Working Age Population 2009.PNG 1,550 × 1,212; 147 KB
-
 Belarus Under Working Age Population 2009.PNG 1,550 × 1,212; 145 KB
-
 BelarusElementaryEducation2009.png 1,550 × 1,212; 145 KB
-
 BelarusHigherEducation2009.png 1,550 × 1,212; 144 KB
-
 BelarusianAsNativeLnaguage2009rural.PNG 1,550 × 1,212; 143 KB
-
 BelarusianAsNativeLnaguage2009urban.PNG 1,550 × 1,212; 146 KB
-
 BelarusPopChange1970-1989.PNG 1,550 × 1,212; 146 KB
-
 BelarusPopulationChange1970-2009.PNG 1,550 × 1,212; 81 KB
-
 BelarusPopulationChange1999-2009.png 1,550 × 1,212; 146 KB
-
 BelarusPopulationDensity2010.PNG 1,550 × 1,212; 132 KB
-
 BelarusUrbanization2009v2.PNG 1,550 × 1,212; 73 KB
-
 Birth rate 2014 Belarus.png 1,241 × 1,315; 74 KB
-
 Birth rate in Belarus and neighbouring countries (2017-18, ru).png 1,000 × 686; 158 KB
-
 Birth rate in Belarus by regions (2018, ru).png 2,000 × 1,785; 371 KB
-
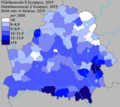 Birth rate in Belarus, 2019.png 2,000 × 1,785; 813 KB
-
 Birth rate in Bresckaja voblasć, Belarus (2017, by districts).png 2,000 × 1,462; 330 KB
-
 Birth rate in Homieĺskaja voblasć, Belarus (2017, by districts).png 2,000 × 1,516; 349 KB
-
 Birth rate in Viciebskaja voblasć, Belarus (2017).png 2,000 × 1,390; 461 KB
-
 BirthRate2010Bel.png 1,241 × 1,315; 123 KB
-
 Death rate 2014 Belarus.png 1,241 × 1,315; 76 KB
-
 Death rate in Belarus, 2019.png 2,000 × 1,785; 1,001 KB
-
 DeathRate2010Bel.png 1,241 × 1,315; 124 KB
-
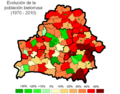 EvoluciónPoblaciónBielorrusia 1970-2010.PNG 767 × 600; 171 KB
-
 Immigration to Belarus (2018, ru).png 2,000 × 1,785; 386 KB
-
 Internal migration in Belarus (2018, ru).png 2,000 × 1,785; 414 KB
-
 Mortality rate in Bresckaja voblasć, Belarus (2017, by districts).png 2,000 × 1,462; 336 KB
-
 Mortality rate in Homieĺskaja voblasć, Belarus (2017, by districts).png 2,000 × 1,516; 338 KB
-
 Natural growth 2014 Belarus.png 1,244 × 1,300; 74 KB
-
 Natural population change in Belarus, 2019.png 2,000 × 1,785; 988 KB
-
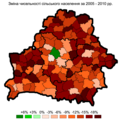
 NaturalGrowth2010Bel.png 755 × 800; 445 KB
-
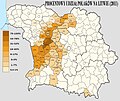 Polacy na Wschodzie.jpg 960 × 808; 114 KB
-
 Population of employable age (share of total) in Belarus, 2006.png 2,000 × 1,785; 708 KB
-
 Population of employable age (share of total) in Belarus, 2014.png 2,000 × 1,785; 703 KB
-
 Population over employable age (share of total) in Belarus, 2014.png 2,000 × 1,785; 710 KB
-
 Population under employable age in Belarus, 2014.png 2,000 × 1,785; 709 KB
-
 RuralChange2005-2010Bel.png 1,242 × 1,253; 119 KB
-
 UrbanChange2005-2010Bel.png 1,242 × 1,253; 118 KB
-
 Ussr natrep 89.jpg 1,364 × 1,234; 244 KB
-
 Брестская область (Беларусь) — население по районам (2019).png 912 × 676; 317 KB
-
 ВИЧ в Беларуси 2021.jpg 800 × 800; 49 KB
-
 ВИЧ в Беларуси нормально.jpg 800 × 800; 48 KB
-
 ВИЧ в Беларуси по регионам.jpg 800 × 800; 51 KB
-
 ВИЧ в Беларуси.jpg 800 × 800; 88 KB
-
 Вич в гомеле.png 608 × 464; 81 KB
-
 Нараджальнасць у Брэсцкай вобласці Беларусі (2017, па раёнах).png 2,000 × 1,462; 333 KB
-
 Нараджальнасць у Віцебскай вобласці Беларусі (2017).png 2,000 × 1,390; 465 KB
-
 Рождаемость в Брестской области Беларуси (2017, по районам).png 2,000 × 1,462; 333 KB
-
 Рождаемость в Витебской области Беларуси (2017).png 2,000 × 1,390; 474 KB
-
 Смертность в Брестской области Беларуси (2017).png 2,000 × 1,462; 340 KB
-
 Смяротнасць у Брэсцкай вобласці Беларусі (2017).png 2,000 × 1,462; 340 KB
.png)
.png)
.png)


.png)
.png)

.png)
.png)
.png)


.png)
.png)
.png)
.png)


_in_Belarus,_2006.png)
_in_Belarus,_2014.png)
_in_Belarus,_2014.png)


_%E2%80%94_%D0%BD%D0%B0%D1%81%D0%B5%D0%BB%D0%B5%D0%BD%D0%B8%D0%B5_%D0%BF%D0%BE_%D1%80%D0%B0%D0%B9%D0%BE%D0%BD%D0%B0%D0%BC_(2019).png)


.png)
.png)
.png)
.png)
.png)
.png)