Category:Climate diagrams of Italy
Jump to navigation
Jump to search
Subcategories
This category has the following 2 subcategories, out of 2 total.
T
- Climate diagrams of Tuscany (26 F)
Media in category "Climate diagrams of Italy"
The following 21 files are in this category, out of 21 total.
-
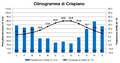 Climogramma di Crispiano.png 4,507 × 2,382; 383 KB
-
 Climogramma di Taranto.png 4,507 × 2,382; 371 KB
-
 Dghsgnsfnf.jpg 405 × 484; 51 KB
-
 Diag ombro Bolo (I).png 1,632 × 970; 41 KB
-
 Diag ombro Tori (I).png 1,636 × 977; 42 KB
-
 Grafico clima Fino del Monte.png 600 × 400; 19 KB
-
 Hum matelica 2009-2010.png 1,200 × 900; 18 KB
-
 Hum matelica 2009-2011 .png 1,200 × 900; 25 KB
-
 Hum matelica 2009-2011.png 1,200 × 900; 24 KB
-
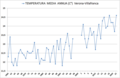 Immagine png VR-Villaf.png 980 × 641; 45 KB
-
 Klima tem nds venz.jpg 1,151 × 1,047; 301 KB
-
 Klima-Rom.svg 1,140 × 316; 23 KB
-
 Klimadiagramm Rom.jpg 600 × 648; 108 KB
-
 Milanokliimadiagraam.png 379 × 468; 13 KB
-
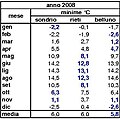 Minime confronto 2008.jpg 424 × 422; 38 KB
-
 Nizza Kliimadiagramm.png 409 × 569; 11 KB
-
 Prec matelica 2009-2010.png 1,200 × 900; 23 KB
-
 Prec matelica 2009-2011.png 1,200 × 900; 22 KB
-
 Precipitazioni in Italia dal 1901 al 2020.png 711 × 497; 108 KB
-
 Temp matelica 2009-2010.png 1,200 × 900; 23 KB
-
 Temp matelica 2009-2011.png 1,200 × 900; 23 KB


.png)
.png)


